
A unified marketing dashboard pulls performance data from every channel you run (paid, SEO, email, social, CRM, web analytics) into one view, with one set of definitions and one attribution logic. The point is not a prettier chart. It is that everyone in the room reads the same numbers and argues about decisions, not about whose report is right. This guide covers what belongs on the dashboard, how the data gets combined, how to keep it trustworthy, and how to get one running without a year-long data project.
TL;DR
- A unified marketing dashboard combines channel data on a shared data model, so spend, conversions and revenue mean the same thing everywhere.
- The hard part is not the charts. It is normalizing data, choosing an attribution approach, and governing data quality and access.
- Start with the five or six decisions the dashboard must support, then connect only the sources those decisions need.
- Every number should be traceable to its source query, and attribution answers should state their confidence.
- An agent-ready connector layer can replace a pile of individual integrations and shorten the build from months to days.
Table of Contents
- What a unified marketing dashboard actually is
- What a unified dashboard should show
- Which channels and data sources to bring together
- How the data is combined, normalized and attributed
- How teams use it to decide
- Benefits and the limits to plan around
- Keeping it reliable: quality, access and privacy
- A practical build plan
- Get a unified view without building every integration
- FAQ
- Sources
What a unified marketing dashboard actually is
Most teams already have dashboards: one in the ad platform, one in web analytics, one in the email tool, one in the CRM. Each is accurate on its own terms and each counts conversions differently. Put them in a slide deck and you get a meeting about reconciliation.
A unified dashboard differs from a stack of channel reports in three ways:
- One data model. Campaigns, channels, dates, currencies and conversion events are mapped to shared definitions before anything is charted.
- One attribution logic. Credit for a sale is assigned the same way for every channel, instead of each platform claiming the win.
- One audience. Executives, channel specialists and clients look at the same figures, with different levels of drill-down.
That is also what separates it from a plain “marketing dashboard,” which can be a single-source view of one tool. Unified means cross-channel and reconciled.
What a unified dashboard should show
The answer to “what should it show” is “what your decisions need,” but most useful dashboards have the same layers. Think of it as a funnel from money in to money back.
| Layer | What it answers | Typical metrics |
|---|---|---|
| Spend and reach | Where is budget going? | Spend by channel, impressions, clicks, CPC, CPM |
| Engagement | Is anyone responding? | CTR, email opens and clicks, social engagement, organic sessions |
| Conversion | Are responses turning into leads or sales? | Leads, signups, conversion rate by channel, cost per lead |
| Revenue | What did it return? | Pipeline, revenue, CAC, ROAS, payback period |
| Search visibility | Are we winning organic demand? | Rankings, share of voice, organic traffic and conversions |
| Competitive context | How do we compare? | Competitor ad activity, pricing moves, review trends |
A few design rules keep this readable:
- Lead with a handful of KPIs. Four to six headline numbers, each tied to a decision such as “shift budget” or “pause campaign.”
- Show trend and comparison. A number without last period or target is trivia.
- Put definitions one click away. If “conversion” means a demo request on one channel and a page view on another, the dashboard has failed before anyone opens it.
- Separate operating views from review views. A channel manager needs daily detail. A CMO needs a weekly summary with budget implications.
Example: a weekly agency client view
An agency serving a mid-sized ecommerce brand might build one page with blended spend and revenue at the top, a channel table beneath it (spend, conversions, cost per conversion, revenue, ROAS), an organic search panel with top gaining and losing queries, and a short “what changed and what we are doing” block. Anything deeper sits behind a drill-down. The client sees one story, and the team spends Monday acting on it, not assembling it.

Which channels and data sources to bring together
A unified dashboard can draw on far more than ad accounts. The usual sources fall into groups:
- Paid media: search, social and display ad platforms, plus retail or marketplace ads.
- Web and product analytics: sessions, events, funnels, conversion paths.
- SEO: rankings, backlinks, technical health, organic landing pages.
- Email and marketing automation: sends, engagement, list growth, campaign conversions.
- CRM and sales: leads, opportunities, closed revenue, which is what lets you connect marketing activity to money.
- Market and competitive data: competitor pricing, ad creative, reviews, category trends.
You do not need all of them on day one. The IAB’s cross-channel measurement playbook makes the same point from the other direction: measurement tools should align with the decisions they support, and where full centralization is not feasible, the priority is interoperability and accessibility across systems. In practice, that means starting with the two or three sources behind your biggest budget lines and your revenue source of truth, then adding the rest.
For a deeper walk-through of the plumbing, see our notes on marketing data integration and a practical guide to building one reliable cross-channel ad reporting view.
How the data is combined, normalized and attributed
This is where unified dashboards succeed or quietly fail. Three steps happen between the platforms and the chart.
1. Collect and normalize
Each platform names things differently, uses its own time zone and currency, and counts a conversion on its own rules. Normalization maps all of that into one schema: a common campaign hierarchy, consistent channel names, one currency, one reporting calendar, and a clear definition for each conversion event. A normalized warehouse is the classic way to do it. One engineering case study describes bringing ad platforms, web analytics and CRM data together in a normalized warehouse so cross-platform questions can be asked in a single query.
2. Resolve identities and deduplicate
The same buyer may click a search ad, open an email and convert days later on direct traffic. Without deduplication, each platform reports the sale. Match keys (UTMs, click IDs, hashed emails, CRM IDs) decide how well you can stitch these together. If your match rate is poor, the dashboard looks precise and is wrong. Our checklist on fixing match rate and marketing data quality covers the usual causes.
3. Apply a measurement approach
Attribution alone is no longer the whole story. One 2026 industry analysis describes unified measurement as blending experiments to validate causality, marketing mix modeling to quantify macro impact and forecast returns, and attribution signals for day-to-day visibility, all on a shared data and governance layer. The practical reading for a dashboard owner:
- Attribution (first-touch, last-touch, linear, time-decay, position-based) is good for operational views: which campaigns and creatives to adjust this week.
- Experiments such as geo holdouts or conversion lift tests tell you whether a channel caused the result.
- Marketing mix modeling informs quarterly budget splits, especially for channels that are hard to track at the click level. This practical guide to marketing mix modeling is a good primer on how the technique fits alongside other methods.
A dashboard does not have to run all three. It does have to say which one a given number comes from. For a worked look at attribution choices, read how analysts fix marketing attribution modeling.
How teams use it to decide
The best dashboards change the question. The same 2026 analysis describes teams moving from asking which touchpoint drove a sale to asking what changed the outcome, and using measurement to guide budget decisions. A dashboard supports that shift when it is built around actions:
- Budget reallocation. Compare cost per incremental conversion across channels, and move money toward the lower figure only after checking sample size and lag.
- Campaign evaluation. Judge a campaign against its own goal (pipeline, signups, revenue) and against the channel baseline, not against platform-reported vanity metrics.
- Creative and offer tests. Line up ad, email and landing page results on one timeline to see which message moved the funnel.
- Client and executive reporting. One consistent view cuts the time spent explaining discrepancies and leaves more for recommendations.
- Anomaly spotting. Sudden CPC jumps, tracking breaks or a competitor price cut show up faster when everything sits in one place.
If you run a campaign across many channels at once, our omnichannel campaign analytics checklist shows how to set up the comparison quickly.
Benefits and the limits to plan around
What you gain
- A single source of truth, so budget conversations start from shared numbers.
- Less manual reporting: no more copying exports into spreadsheets every Friday.
- Faster detection of waste and of channels that deserve more budget.
- Easier onboarding for new team members and clients, since definitions live in one place.
What to plan for
- Definitions take work. Agreeing what counts as a lead or a conversion is a business decision, not a technical one. Do it first.
- Data is only as good as its inputs. Missing UTMs, consent gaps and platform API changes will show up as holes. Build checks, not hope.
- Not every channel is measurable at the click level. Brand, podcast, out-of-home and some social effects need modeling or experiments to complement attribution.
- Cookie loss affects tracking. A 90-day cookieless analytics plan helps you reduce dependence on third-party identifiers.
Treat these as design inputs. Each has a known fix, and teams that plan for them get a dashboard people trust.
Keeping it reliable: quality, access and privacy
A dashboard that people stop trusting stops being used. Three habits protect it.
Governance and validation. The IAB playbook says data quality in cross-channel measurement requires governance policies and validation processes to keep data accurate, consistent and complete. Write down who owns each dataset and what “correct” means for it.
Monitoring. One practitioner guide on building a single source of truth recommends monitoring freshness, completeness, duplicates and failed loads, with alerts and a named owner for each dataset. A simple daily check that spend totals match the ad platform within a tolerance catches most breakages.
Privacy and access. The same guide lists consent, purpose limitation, retention rules and regional residency built into pipelines, along with access controls. In practice: give client and role-based views only the data they need, keep personal data out of the reporting layer where you can, and document where each dataset is stored. This guide to data mapping practices for privacy audits shows how to document data flows so those controls can be audited.
Make every number inspectable
Trust grows when people can check the math. One approach is to ground numerical answers in logged, inspectable SQL queries and to disclose confidence on every attribution answer. That discipline matters even more when AI agents draft the commentary: the number, its query and its confidence level should travel together. For the business case behind this rigor, this look at how analytics drives marketing ROI is useful reading.
A practical build plan
- List the decisions. Write down five to eight recurring decisions (shift budget, renew a retainer, pause a campaign, report to the board).
- Define the metrics. For each decision, name the metric, its formula, its source and its owner.
- Pick the minimum sources. Connect the ad platforms, analytics and CRM behind your largest spend and your revenue figure.
- Normalize before visualizing. Settle naming, currency, time zone and conversion definitions first.
- Choose the attribution approach and label it. Say which method each view uses.
- Add quality checks and owners. Freshness, completeness, duplicates, failed loads.
- Ship a first version in a week or two. Collect feedback, then widen coverage.
- Review quarterly. Drop metrics nobody uses and add the ones decisions demand.
Our cross-channel marketing metrics and marketing data visualization posts go deeper on metric selection and chart design, and the marketing data management archive covers the upkeep.
Our perspective
We built Prowl because the slowest part of marketing analysis is rarely the thinking. It is wiring up one integration after another before anyone can ask a question.
Our view is that a unified dashboard should start from a single access point. Prowl connects an AI agent or workflow to 444 marketing intelligence tools through one API, so ad performance, SEO, funnels, reviews, pricing and market trends can be pulled into one workflow and cross-referenced, instead of living in separate exports.
We also believe a report is only worth acting on when each number can be traced to its source. That is why we design for deep reporting with traceable figures, honest claim verification and transparent coverage gaps, so you know what the data supports and where it stops.
The result we aim for is simple: synthesized, actionable reports in minutes rather than hours, delivered in the format your audience actually reads, whether that is an interactive report, PDF, PPTX, infographic, video or audio.
Prowl Team
Get a unified view without building every integration
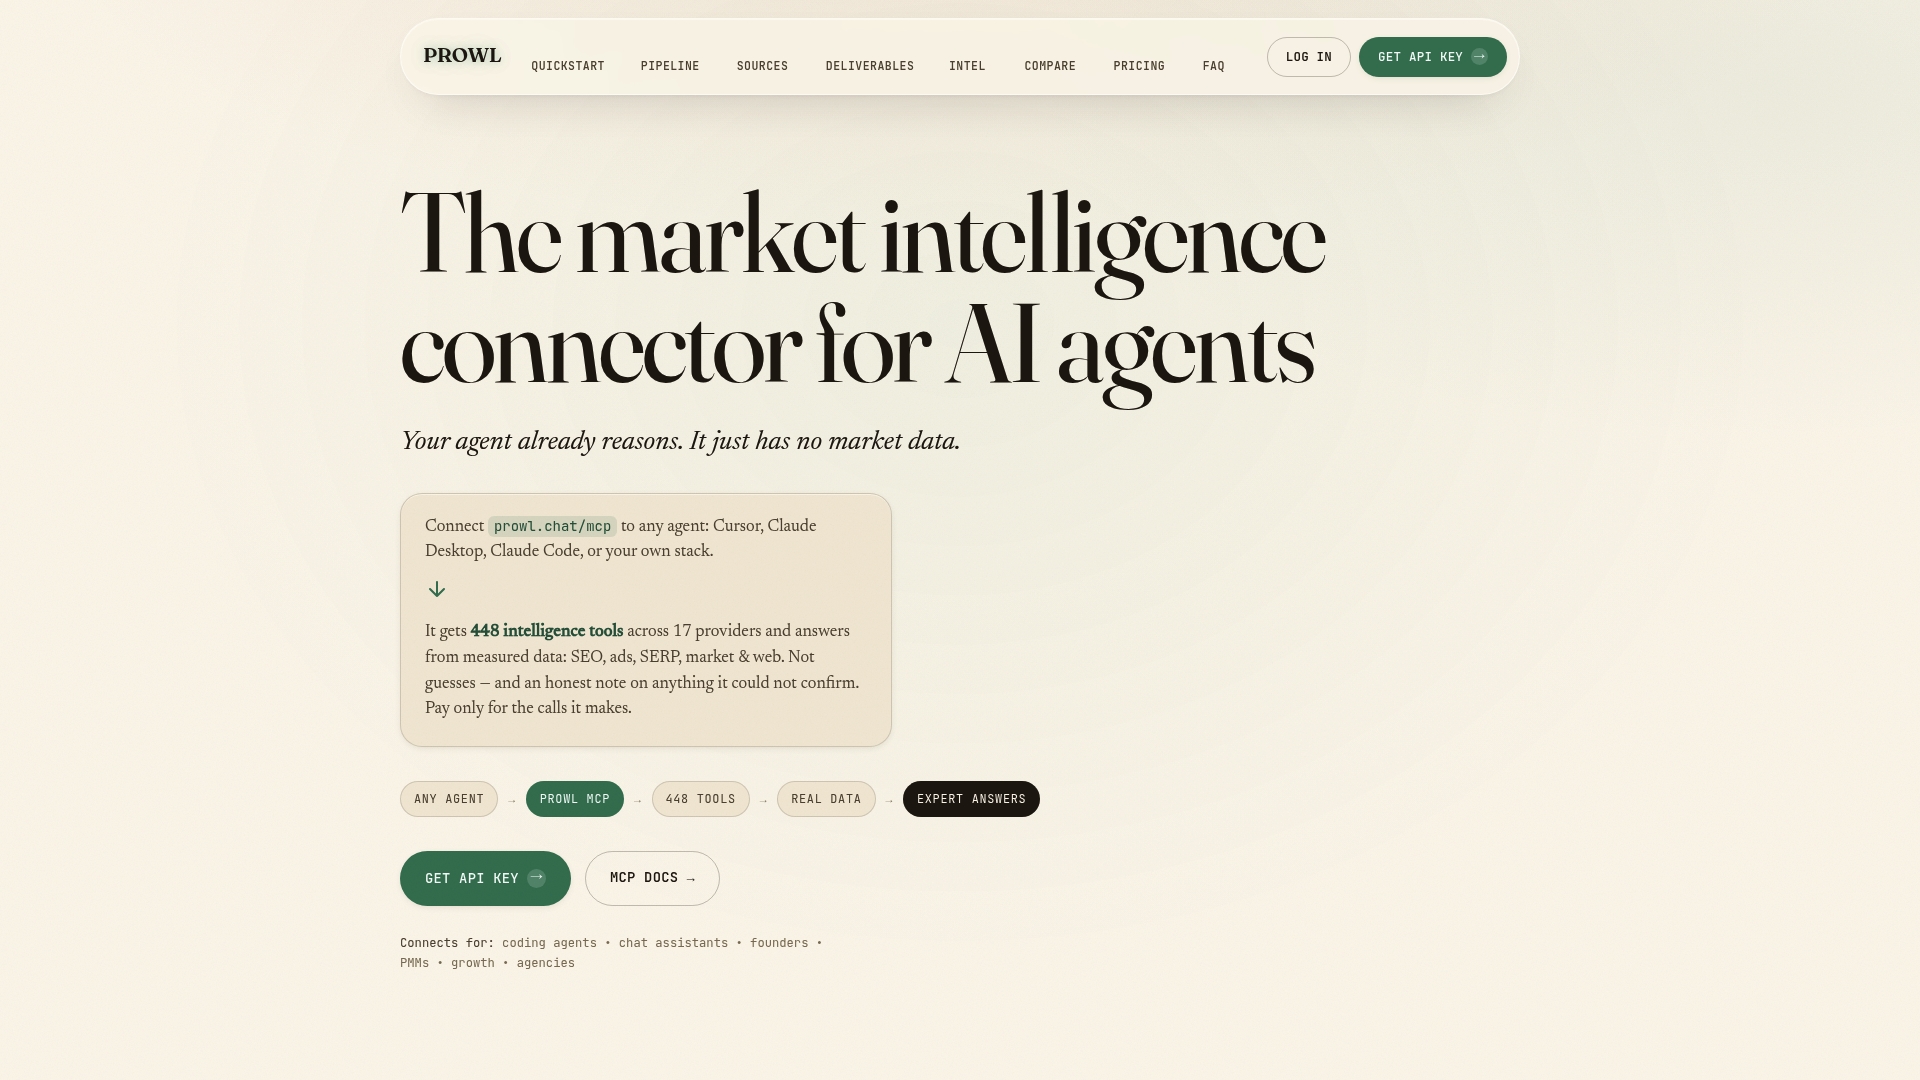
If you would rather spend your time on decisions than on connectors, Prowl gives your agent or workflow one endpoint to 444 market-intelligence tools. Ask for a cross-channel performance report, a competitive scan or an SEO and ad tracking summary, and receive it with sources attached.
Pricing is metered. You can top up credits ($10, $50 or $200, one-off) or choose a monthly plan: Exploit at $60 per month, Blackops at $120 per month or Syndicate at $240 per month. See plans and credit options, or browse what teams do with it. If you work in an AI editor, the Cursor MCP server page shows the setup, and the Prowl home page gives the overview. For faster ad analysis specifically, read how teams cut analyst hours on ad performance analysis.
FAQ
What is a unified marketing dashboard?
It is a single reporting view that pulls data from all your marketing channels onto one data model with one attribution logic. Instead of reconciling separate platform reports, you read one set of definitions and numbers that the whole team shares.
What should a unified marketing dashboard include?
Start with spend, engagement, conversions and revenue by channel, then add organic search and CRM outcomes so you can see return, not just activity. Keep headline KPIs to a handful, show trends against targets, and make metric definitions easy to find.
How is it different from a regular marketing dashboard?
A regular marketing dashboard may show one tool’s metrics or simply place charts side by side. A unified one reconciles sources first: shared naming, currency, conversion definitions and attribution, so figures from different channels can be compared directly.
How do I keep the numbers trustworthy?
Assign an owner to each dataset, monitor freshness, completeness, duplicates and failed loads, and check totals against the source platforms regularly. Label which measurement method each figure uses, and keep access limited to what each role needs.
How long does it take to build one?
The timeline depends on how many sources you connect and how clean your tracking is. Starting with only the sources behind your biggest budget lines and revenue, and using a ready-made connector layer, keeps the first version to days or weeks, not months.
Sources
- The New Rules of Marketing Measurement in 2026
- IAB: Implementing Cross-Channel Measurement for Marketers Playbook, November 2024
- How do I create a single source of truth for marketing data?
- Designing a Grounded, Read-Only Marketing Intelligence Agent System
- Marketing Mix Modeling: A Practical Guide for 2026
- Data Mapping Best Practices That Stand Up to PIPEDA Audits
- Why analytics in marketing drives better ROI in 2026