
Data synthesis for marketing is the work of combining data from several sources, such as ad platforms, analytics, CRM, reviews and market research, into one coherent picture you can make a decision from. It is more than moving data into one place. The synthesis is the step where separate numbers are reconciled, cross-checked and turned into a finding. This guide shows how to do it, where “synthetic data” fits in (and where it does not), and how to keep every number traceable.
TL;DR
- Data synthesis means combining and reconciling multiple marketing sources into one finding. Integration moves the data, and synthesis interprets it.
- Synthetic data is a different thing: modeled data created by AI. Treat it as a planning aid and never as observed fact.
- A repeatable process has five steps: define the decision, collect, standardize, cross-reference, then validate and trace.
- Every synthesized number should link back to its source, and every gap should be stated, not smoothed over.
- Agents can now do the assembly work, so your analysts spend their hours on judgment.
Table of Contents
- What data synthesis means in marketing
- Why synthesis matters more than another dashboard
- What decisions synthesis can support
- A five-step process for synthesizing marketing data
- Where synthetic data fits, and where it does not
- Privacy and fairness checks
- A worked example: a competitor review in one afternoon
- Perspective
- Automating the assembly with one connector
- Try it on your next report
- Common mistakes to avoid
- A short checklist before you share the findings
- FAQ
- Sources
What data synthesis means in marketing
The plain definition: data synthesis is the process of combining multiple sources of data to generate meaningful insights and draw conclusions. In marketing, that usually means taking your own numbers (ad spend, sessions, conversions, email results, CRM revenue) and setting them beside outside evidence (competitor activity, search demand, pricing, reviews) until the story holds together.
Three terms get mixed up, and the difference matters for how much you can trust the output.
| Term | What it does | Output is |
|---|---|---|
| Data integration | Collects data from many sources, standardizes formats and loads it into one place | A unified dataset |
| Data synthesis | Reconciles and interprets those sources to answer a question | A finding or recommendation |
| Synthetic data | Uses a model to generate data that did not come from real people or events | A modeled dataset |
Marketing data integration combines data from multiple marketing sources into a unified system, commonly by extracting, transforming and loading it into a central environment. That is the plumbing. Synthesis sits on top of it.
Synthetic data is the confusing neighbor. The Marketing Association of New Zealand defines it as data created by AI from previously collected data that was not itself created by AI. Several of the pages that rank for this keyword are about synthetic data, so you may have landed here looking for that. We cover it below, because the key skill is the same in both cases: knowing which parts of your evidence were observed and which were modeled.
Why synthesis matters more than another dashboard
Most teams do not lack data. They have too many versions of it. Google’s Arno Witte put the problem this way: organizational silos can create competing versions of the truth, while a unified model can calibrate itself to all available evidence.
You see this in daily work:
- The ad platform reports more conversions than your analytics tool does.
- Search demand is rising, but pipeline is flat.
- A competitor’s pricing page changed last week and nobody on the team knows.
- Reviews mention a feature gap that never reaches the roadmap discussion.
Each source is correct inside its own walls. The decision, however, lives across all of them. Synthesis is the discipline of making them speak to each other.
What decisions synthesis can support
The IAB’s cross-channel measurement playbook lists media-spend optimization, customer-experience improvement, consumer-behavior analysis and forecasting future trends as the payoffs of combining measurement across channels. In practice, teams use synthesis for questions like these:
- Budget allocation. Which channels deserve the next dollar once platform-reported results are reconciled with your own revenue data?
- Competitive positioning. How do our ads, pricing and search visibility compare with the alternatives our buyers consider?
- Market entry and validation. Is demand real, who serves it, and what do customers complain about?
- Creative direction. Which hooks and angles do competitors keep running, which suggests they work?
- Funnel diagnosis. Where does traffic turn into drop-off, and does the review data explain why?
- Trend reading. Are pricing and demand moving in the same direction across sources?
For product managers and founders, the emphasis falls on questions 2, 3 and 6. For agencies and growth teams, it falls on 1, 4 and 5.
A five-step process for synthesizing marketing data
1. Start with the decision, not the data
BCG’s research on responsible first-party marketing describes a pattern in mature marketers: they set a strategy that supports business objectives, then gather, store, cleanse and combine data, then analyze and activate it across the purchasing funnel. The order is the point. Write the decision first (“Should we shift 20% of paid social to search?”), then list which sources could change your answer.
2. Collect from every source that could change the answer
A marketing data management platform typically gathers data from internal systems such as CRM, websites and email, plus external partners, according to Gartner. Add the outside view too: competitor ads, search trends, pricing, and review sentiment. Internal data tells you what happened to you. External data tells you why it may have happened.

If you have a first-party data program, a good first-party data strategy makes this step cleaner, because the data you own is consented, structured and ready to join.
3. Standardize before you compare
Different tools define a “conversion,” a “session” or a “click” differently. Before any comparison, align:
- Time windows (attribution windows, time zones, week starts)
- Currencies and units
- Identifiers (campaign names, UTM conventions, product SKUs)
- Definitions (what counts as a lead, an engaged session, a qualified visit)
Match rate is where this step often breaks. Our guide on fixing match rate in marketing data quality walks through four steps for it. For the broader mechanics of pulling sources together, see our piece on marketing data aggregation, and our notes on blending data without spreadsheet joins.
4. Cross-reference, and look for disagreement
This is the real synthesis step. Put two or three sources side by side and look for where they disagree. Disagreement is information:
- Platform conversions up, backend revenue flat: possible over-attribution or a lag.
- Search interest up, your branded traffic flat: you may be losing share to a competitor.
- Strong ad metrics, poor reviews: the promise is outrunning the product.
A finding supported by three independent sources is far stronger than one from a single polished dashboard. Our tag pages on cross-channel marketing metrics and ad performance analysis go deeper on comparing across platforms.
5. Validate, then trace every number
The IAB recommends regular audits, quality-assurance processes and a troubleshooting framework to verify measurement accuracy and consistency. Make this concrete with a simple rule: no figure goes into a deck without a source, a date range and a note on how it was collected. If a number cannot be traced, label it an assumption.
Where synthetic data fits, and where it does not
Synthetic data has real uses. The New Zealand marketing association’s perspective says it may be faster and cheaper, privacy compliant, and able to give views of historically hard-to-reach segments. The same document lists marketing uses including brand-perception research, purchase-intent estimation, creative and message testing and media planning.
In analytics, GreenBook describes a modeled dataset that can combine separate measurement sources, or validate attribution and media-effectiveness models, when direct cross-platform data are unavailable. It adds that models must preserve relationships such as covariance. Otherwise combined reach or attribution estimates can mislead.
Know the accuracy limits
Recent academic work is useful for calibrating expectations:
- A literature review of 285 silicon-to-human sample comparisons found that 65.3% diverged, 24.9% gave similar results and 9.8% partially aligned.
- In one study, synthetic responses consistently overestimated positive brand attitudes and varied less than real participants’ answers.
So synthetic respondents suit early hypothesis work, such as stress-testing a message before you spend on fieldwork. They are a poor basis for a final budget decision. The practical guidance from the research: critically evaluate model outputs, benchmark synthetic samples against human-generated data, use multiple models and add context such as retrieval-augmented generation.
The marketing-association document also warns that results depend on suitable, relatively unbiased training data and prompts, and that synthetic results are not established as superior to traditionally collected data. Read that as a labeling rule: every chart that includes modeled data should say so.
The same logic applies to AI-assisted measurement more broadly. If you want a worked example of the topic in practice, this piece on measuring brand awareness with AI analytics shows how teams think about it.

Privacy and fairness checks
Synthesis often crosses platforms, and that raises two risks.
Privacy. The WFA cross-media measurement framework calls for de-duplicated reach and frequency across media while preserving privacy principles. Work with aggregated or consented data wherever you can, and keep personal identifiers out of the synthesis layer unless you have a clear legal basis. For the specific rules that apply to you, talk to your privacy counsel.
Fairness. The same framework says methodology should be fair and not favor or disadvantage any publisher, media or platform. In practice, check that your blended model is not quietly rewarding whichever platform reports the most generously.
For audiences activated through retail or commerce media, an audience data activation playbook can help you plan the step that comes after synthesis.
A worked example: a competitor review in one afternoon
Say you are a product manager at a project-management app and you need to decide whether to build a reporting feature. The old way is a week of exports and screenshots. The synthesized way looks like this:
- Decision: build or skip a reporting module this quarter.
- Sources: search demand for reporting-related terms, competitor ad copy, competitor pricing tiers, and recent public reviews of your category.
- Standardize: same date range (last 90 days), same competitor set, same currency.
- Cross-reference: if reviews of competitors cite weak reporting, and competitors advertise reporting heavily, and search demand is growing, three sources agree. If only ads mention it, you may be looking at marketing noise.
- Validate and trace: each claim in the summary links to the review set, ad set or dataset behind it. Gaps are listed (for example, “no pricing found for two competitors”).
The output is a short report with a recommendation and a confidence level, not a pile of screenshots.
Perspective
We built Prowl because the hardest part of synthesis is rarely the thinking. It is the assembly. Analysts spend hours exporting from one tool, reformatting in a spreadsheet and joining by hand, and by the time the picture is complete, the market has moved.
Our view is that an AI agent should do that assembly, and that it should do it through one connection, not dozens. Prowl gives an agent a single endpoint to 444 marketing intelligence tools, so a question like “how do we compare with our three closest alternatives?” can pull from ads, SEO, reviews, pricing and funnel data in one workflow.
We also think synthesis without traceability is just a confident guess. Our approach is designed so every number in a report can be traced back to its source, and so coverage gaps are stated openly instead of papered over. That is what lets a team act on a finding rather than argue about where it came from.
The result we aim for is simple: verified insight in minutes instead of hours, in the format your stakeholders actually use, whether that is an interactive report, a PDF or a slide deck.
Prowl Team
Automating the assembly with one connector
If you run agents or automated workflows, the cleanest setup is one connection that exposes many data tools, so you are not building and maintaining a separate integration for each. That is the idea behind Prowl’s single-endpoint approach, and you can see the kinds of reports teams run on the use cases page. Developers working in an editor can start from the Cursor MCP server setup, and creative teams can see how ad creative research works for finding hooks that competitors keep running.
For broader reading, our blog tags on marketing data integration, marketing data management, data-driven marketing strategies and marketing data visualization collect our latest guides.
Try it on your next report
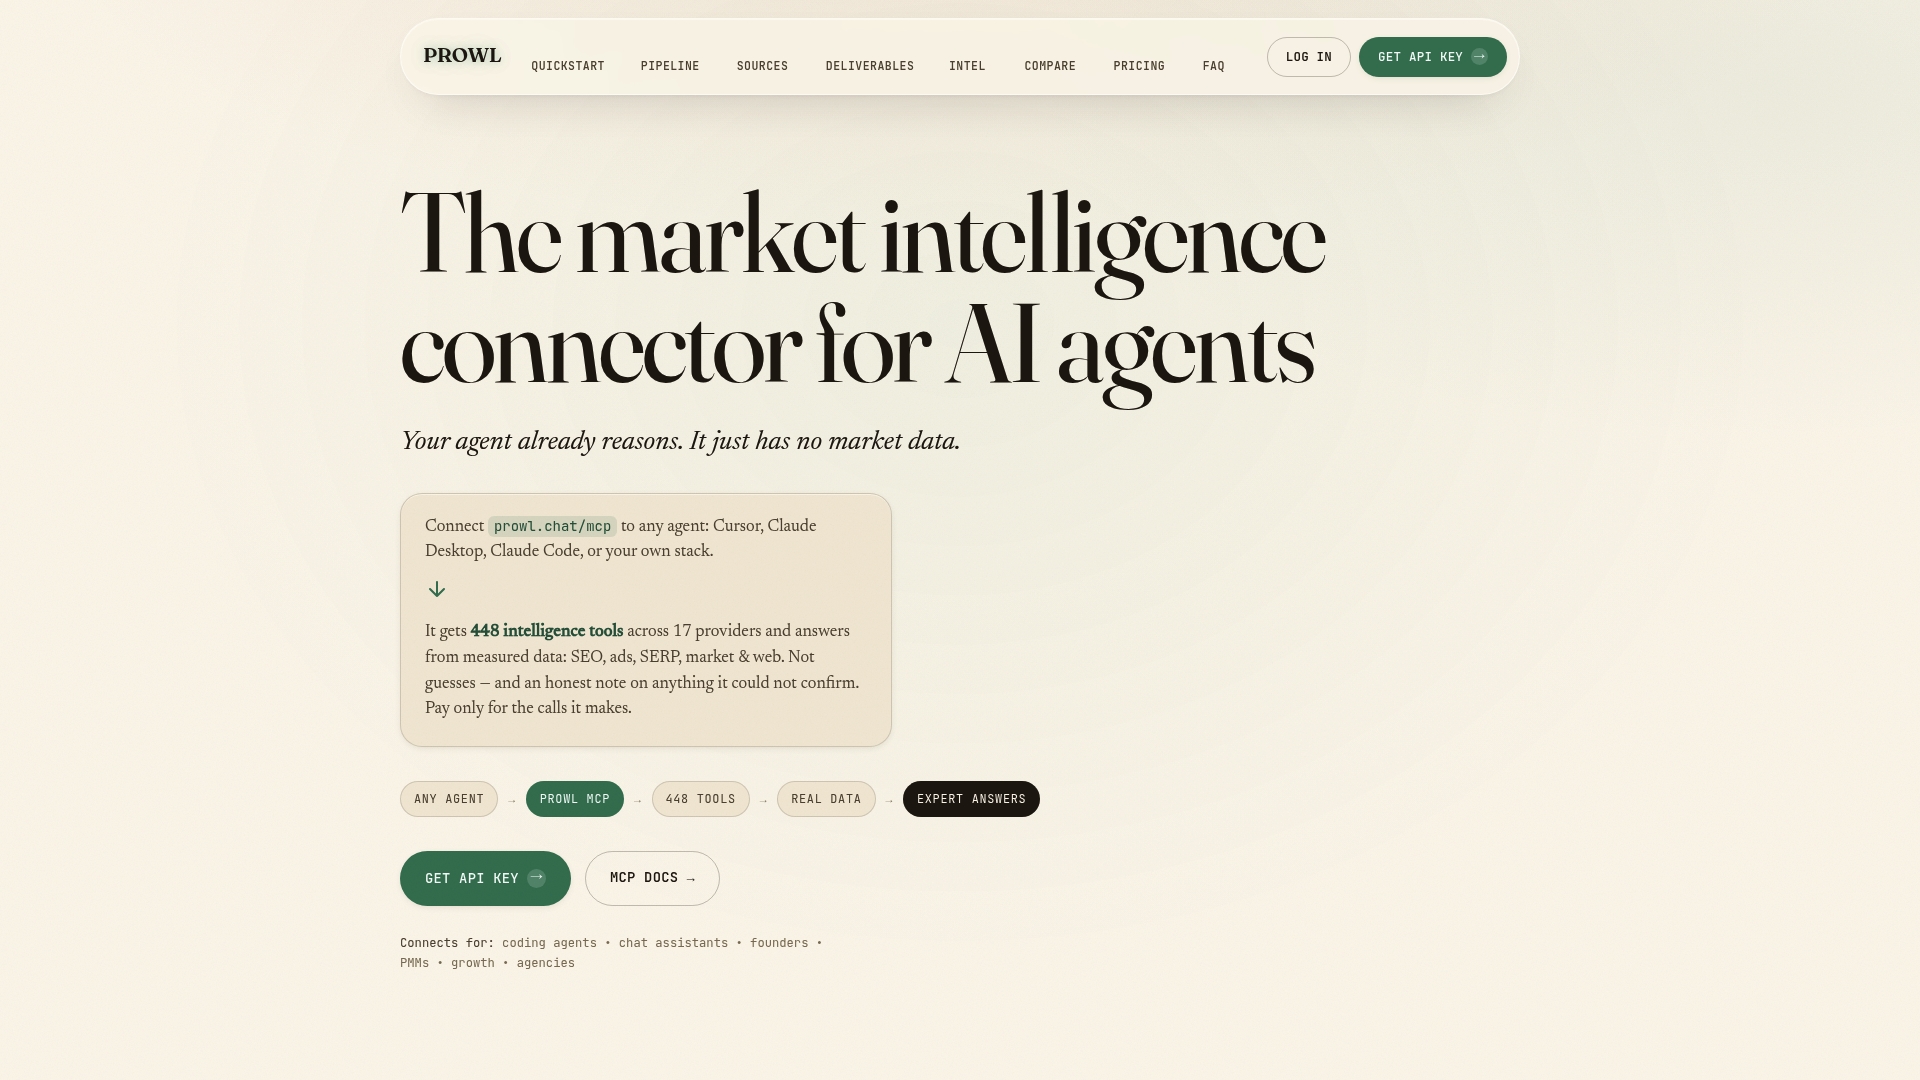
Prowl connects any AI agent or workflow to 444 marketing intelligence tools through one API, covering competitive analysis, SEO and ad performance tracking, funnel and review analysis, and pricing and market trend research. Reports can be delivered as interactive reports, PDFs, infographics, PPTX, video or audio.
Billing is metered. You can top up pre-paid credits in three sizes ($10, $50 or $200, each a one-off purchase) or choose a monthly plan: Exploit at $60 per month, Blackops at $120 per month or Syndicate at $240 per month. Recon is also listed, without a published price. See the full details on the Prowl pricing page.
Common mistakes to avoid
- Treating integration as synthesis. A unified dataset is only a starting point. If nobody has reconciled the sources and written the finding, you have storage, not insight.
- Mixing modeled and observed data without labels. Readers will assume everything on the slide was measured.
- Using one source for a multi-source question. If the answer would change when you add a second source, add it.
- Skipping the audit. Build in the regular checks the IAB recommends, and re-run them whenever a platform changes its reporting.
- Hiding gaps. “No data found for this segment” is a better line than a smooth chart built on guesses.
- Starting with tools. Pick the decision first. Otherwise you will synthesize everything and conclude nothing.
A short checklist before you share the findings
- Does the report state the decision it supports?
- Are all sources named, with date ranges?
- Are definitions aligned across sources?
- Is each number linked to where it came from?
- Is anything modeled or synthetic clearly marked?
- Are the gaps and the confidence level written down?
- Does the recommendation survive if the weakest source is removed?
If you can answer yes to all seven, the report is ready for a stakeholder.
FAQ
What is data synthesis in marketing?
It is the process of combining several data sources, such as ad platforms, analytics, CRM and market research, and reconciling them into a single finding that supports a decision. It goes a step beyond integration, which only collects and standardizes the data. The output is an interpretation, not just a dataset.
Is data synthesis the same as synthetic data?
No. Data synthesis combines real sources into insight. Synthetic data is artificially generated by a model from previously collected data. You can use synthetic data inside a synthesis, but it should be labeled as modeled and checked against real data wherever possible.
How do I keep synthesized numbers trustworthy?
Link every figure to its source and date range, align definitions before comparing, and run regular audits of measurement accuracy. State gaps openly. A report that shows what it could not find is easier to trust than one that looks complete.
Which marketing decisions benefit most from synthesis?
Budget allocation across channels, competitive positioning, market validation, creative direction and funnel diagnosis all benefit, because each depends on evidence that sits in more than one tool. Single-source questions, such as one email’s open rate, rarely need it.
Can an AI agent do data synthesis for me?
An agent can handle the collection, standardization and first-pass cross-referencing quickly, provided it has access to the right data tools. You still define the decision and review the findings. Connecting the agent through one endpoint, as Prowl does, reduces the setup work.
Sources
- Data Synthesis: Everything You Need to Know (Alooba)
- Marketing Data Integration: Types, Benefits, & Best Practices (NetSuite)
- A Perspective on Synthetic Data in Marketing (Marketing Association of New Zealand)
- Unified online marketing measurement (Think with Google)
- Implementing Cross-Channel Measurement for Marketers (IAB)
- Responsible Marketing with First Party Data (BCG)
- How Does a Data Management Platform Work? (Gartner)
- Are You Using Synthetic Data for Analytics? (GreenBook)
- Your Next Respondent Might Be an LLM
- Leaving Insight to Digital Twins? (NIM)
- WFA CMM Framework v10