
The fastest path to control is to aggregate spend from every platform into one place, normalize the numbers, and monitor them on short cycles with alerts that fire before a budget blows past its limit. Set thresholds at 50%, 75%, and 90% of budget, auto-pause at 100%, and check automated feeds every 15 minutes rather than once a day. Do that, and you get defensible ROAS numbers and finance reports that close faster. A connector like a market intelligence connector can get this running in hours instead of weeks.
TL;DR:
- Aggregating and normalizing ad spend data across multiple platforms enables real-time alerts at 50%, 75%, 90%, and 100% budget thresholds, preventing overspending.
- Using API-driven automated monitors every 15 minutes provides the quickest detection of budget spikes compared to manual spreadsheets or daily platform reports.
- Standardizing naming conventions, currency, and time zones is essential to maintain accurate cross-channel reports and avoid common errors like misattribution or duplication.
- Tightly tracking spend allows early identification of underperforming campaigns, safeguarding margins, improving attribution accuracy, and reducing waste.
- Connecting accounts via tools like a market intelligence connector fast-tracks setup, simplifies cross-platform analysis, and supports ongoing fast-cycle alerting tailored to high-velocity budgets.
Table of Contents
- What Is Ad Spend and How Do You Calculate It?
- Why Tracking Ad Spend Actually Protects Your Margin
- Which Metrics Should You Monitor Every Week?
- Spreadsheets vs. Platform Reports vs. Automated Monitors: Which Fits Your Setup?
- How to Set Up an Aggregated Ad Spend Tracker
- What Alert Thresholds Actually Prevent Overspend?
- Connecting Spend Data to Attribution and Finance
- Fixing the Most Common Spend Reporting Errors
- Prowl in Practice: Faster Setup, Faster Alerts
- Using APIs to Pull Spend Data Automatically
- How Data Privacy Rules Affect Ad Spend Tracking
- When Automation Makes Sense (and When It Doesn’t)
- Get Your First Cross-Channel Spend Report Running Today
- Sources
- FAQ
What Is Ad Spend and How Do You Calculate It?
Ad spend is the total amount of money paid to media platforms for advertising during a given period, including platform charges, ad network billings, and any associated placement fees. It’s a straightforward concept until you try to reconcile it across five platforms with different billing cycles, currencies, and refund policies. AppsFlyer defines it as the sum of platform charges for a campaign period, adjusted for refunds or credits, which is the formula most finance teams expect to see.
In practice, three calculations matter most:
- Campaign spend = sum of daily platform spend across all channels, minus refunds and credits issued during the period.
- Daily pacing = campaign spend divided by campaign days elapsed, compared against planned daily budget.
- ROAS input = conversion value (not just conversion count) divided by ad spend for the same window, matched to the same attribution model.
That last point trips up more marketers than any other. If your conversion value pulls from a 7-day click window but your spend closes on a 1-day view, your ROAS is comparing two different realities.
Why Tracking Ad Spend Actually Protects Your Margin
Poor spend visibility doesn’t just waste money, it erodes the trust that keeps client relationships and internal budgets intact. When a campaign overspends by 30% before anyone notices, someone has to explain it, and “the dashboard was a day behind” is not an answer finance teams accept twice.
Marketers waste roughly one-quarter of their advertising budgets on inefficiencies and misallocated spend, according to eMarketer’s analysis. That is not a rounding error. On a substantial monthly budget, a significant amount can be lost through gaps most teams never audit.
The consequences compound as budgets scale:
- Overspend on underperforming campaigns starves the channels actually driving revenue.
- Weak attribution makes it impossible to prove ROI to stakeholders who control next quarter’s budget.
- Client churn accelerates when agencies can’t explain spend variance in real time.
- Programmatic channels are absorbing a growing share of global digital ad spend, and programmatic budgets are notoriously harder to track without cross-channel aggregation.
Tracking spend tightly isn’t about micromanaging pennies. It’s about catching the moment a campaign’s cost curve bends the wrong way, while there’s still budget left to fix it.
Which Metrics Should You Monitor Every Week?
Five numbers matter more than the rest, and mixing them up is the most common analytical mistake in ad operations.
- ROAS (return on ad spend): conversion value divided by spend. Useful for quick channel comparisons, but a blended ROAS across five platforms can hide a channel that’s bleeding money.
- CPA (cost per acquisition): spend divided by conversions. Simple, but doesn’t account for the quality or lifetime value of what you acquired.
- CAC (customer acquisition cost): total spend divided by new customers, often adjusted to include sales and overhead beyond media cost.
- Conversion rate: conversions divided by clicks or impressions, the leading indicator that something in targeting or creative has shifted.
- Pacing: actual spend versus planned spend for the elapsed period, the single fastest signal of an overspend in progress.
A funnel-adjusted CAC solves a real problem: raw CPA treats every conversion as equal, but a lead that converts to a $10,000 contract shouldn’t be measured the same way as one that churns in a week. When you compare channels on CPA alone, the channel generating cheap, low-quality leads looks artificially strong.
Blended ROAS is convenient for a board slide, but it flattens the variance between your best and worst channels into a single misleading number. Break it out by platform before you make any budget decision.
Pro Tip: Standardize your conversion window and reporting currency across every platform before comparing metrics. A campaign reporting in a 7-day click window will always look better than one on a 1-day view, even with identical performance.
Spreadsheets vs. Platform Reports vs. Automated Monitors: Which Fits Your Setup?
Choosing a tracking method comes down to how many platforms you run, how fast budgets move, and how much risk an overspend actually carries for your business.
-
Spreadsheets. They work fine for a single client running two or three campaigns with a fixed monthly budget. Build a template with columns for platform, daily spend, cumulative spend, budget cap, and variance percentage, and update it manually. The failure mode is predictable: someone forgets to update it for three days, a campaign quietly overspends, and nobody notices until the invoice arrives. Spreadsheets don’t scale past a handful of accounts without dedicated headcount to babysit them.
-
Platform-native reports. Google Ads, Meta Ads Manager, and LinkedIn’s campaign manager all offer solid budget controls and daily spend summaries. The advantage is accuracy at the source. The problem is that each platform is a silo. Google’s own budget tools manage spend within Google Ads well, but they can’t tell you that your combined Google plus Meta plus LinkedIn spend just crossed 90% of the total monthly budget three days early. Most platform dashboards also refresh on a daily cycle, which means a spike at 9 a.m. might not surface until the next morning’s report.
-
Connectors and BI tools. Pulling platform data into a business intelligence layer (a data warehouse plus a visualization tool) gives you cross-channel visibility and historical trend analysis. Sync cadence typically runs every few hours to once daily, depending on the connector and API rate limits. This works well for retrospective analysis and reporting to stakeholders, but the lag makes it a poor fit for catching an overspend as it happens.
-
Automated monitors. These pull data via API on short cycles, often every 15 minutes, normalize it across platforms, and fire alerts against preset thresholds. This is the only method built for real-time detection rather than after-the-fact analysis, and it’s the approach most consistently recommended for teams managing multiple accounts or fast-moving budgets. The tradeoff is setup complexity: you need API access to each platform, a normalization layer for currency and time zones, and a place to route alerts.
How to Set Up an Aggregated Ad Spend Tracker
Building a reliable cross-channel tracker is less about tools and more about getting the foundational decisions right before you connect a single account.
- Map every account and standardize naming. List every ad account across every platform, then agree on a UTM and campaign-naming convention before you build anything. Inconsistent naming is the number one reason aggregated reports break.
- Choose your data sources and sync cadence. API connections give you the freshest data and support short-cycle monitoring; CSV exports are fine for weekly retrospectives but useless for catching a same-day overspend.
- Normalize currency and time zone. If you run campaigns in USD, GBP, and EUR, convert everything to one reporting currency at a consistent daily rate, and standardize all timestamps to a single time zone before comparing spend across accounts.
- Build budget-versus-actual logic. Every campaign needs a stored budget figure and a live actual-spend figure, updated on the same cadence, so pacing variance calculates automatically instead of requiring a manual check.
- Design the dashboard views that matter. A single leadership view (blended spend, blended ROAS, total pacing) and a channel-level view (spend, CPA, conversion rate, pacing per platform) cover most use cases.
Practical checklist before you go live:
- Confirm API access and permissions on every ad account.
- Test the normalization logic against a known historical week to catch calculation errors early.
- Set at least one alert threshold before launch, even if it’s a rough estimate.
- Document the UTM convention somewhere every team member can find it.
What Alert Thresholds Actually Prevent Overspend?
A threshold ladder works better than a single “stop” trigger, because it gives you time to react instead of finding out after the damage is done.
- 50% of budget spent: informational alert only. It confirms pacing is roughly on track.
- 75% of budget spent: review trigger, someone checks whether the remaining budget matches remaining campaign days.
- 90% of budget spent: escalation trigger, a decision needs to happen within hours, not days.
- 100% of budget spent: auto-pause where the platform supports it, or an immediate manual pause if it doesn’t.
Monitoring cadence matters as much as the thresholds themselves. Automated systems checking every 15 minutes catch a spike while there’s still budget left to react to it. Daily-only checks, common with manual spreadsheet updates, routinely miss gradual overspend that compounds over several hours before anyone notices. Short monitoring cycles paired with clear thresholds are consistently the difference between catching an issue at 10 a.m. and catching it after the invoice arrives.
Route alerts to a channel people actually check. A Slack or Teams webhook tied to the account owner works better than an email that sits unread. Escalation should have a name attached at each threshold level, not just a channel.
Pro Tip: Set your 90% threshold slightly lower for new campaigns with unproven creative. A fresh campaign with unpredictable performance needs a tighter leash than one that’s been running steadily for months.
Connecting Spend Data to Attribution and Finance
Spend numbers only mean something once they’re matched to revenue, and that match has to survive a finance team’s scrutiny.
Match spend to revenue using the same attribution model and the same time window every time. If you calculate ROAS with a 7-day click attribution model for one report and a 1-day view model for another, the two numbers aren’t comparable, even if both are technically correct. Pick one model, document it, and apply it consistently across every channel comparison.
- Use funnel-adjusted CAC, not raw CPA, when comparing channels with different lead quality.
- Export spend data in a consistent format (CSV or API feed) with UTC timestamps to avoid timezone disputes with finance.
- Reconcile currency conversions at the source, not after aggregation, to prevent rounding errors from compounding across dozens of transactions.
- Keep a monthly reconciliation log that ties platform-reported spend to the actual invoice amount, since these two numbers occasionally diverge due to billing delays.
Getting this right once saves hours of back-and-forth every month when finance asks why the numbers in the dashboard don’t match the invoice.
Fixing the Most Common Spend Reporting Errors
Most spend-tracking errors trace back to one of three root causes, and each has a fast diagnostic.
- Broken pixels or attribution gaps. If conversion counts drop suddenly while spend stays flat, check pixel firing first. A broken pixel doesn’t stop spend, it just stops you from seeing what that spend produced.
- Duplicate imports and double counting. This happens most often when a connector syncs the same date range twice after a manual re-run. Build a deduplication check on campaign ID plus date before totals get calculated.
- Currency and timezone mismatches. A campaign spending in EUR reported against a USD budget without conversion will look wildly over or under budget. Audit your normalization layer whenever a number looks implausible at a glance.
Incorrect campaign naming compounds all three problems, since a mismatched name means a connector can’t map spend to the right budget line in the first place.
Prowl in Practice: Faster Setup, Faster Alerts
Building the aggregation and normalization layer described above from scratch takes real engineering time: API integrations per platform, a normalization pipeline, and a dashboard layer on top. Some platforms compress that into a single connection point, allowing connection through one market intelligence connector (MCP) to access many intelligence tools covering ad performance, SEO, and competitor analysis without setting up each tool individually.
A typical workflow looks like this: connect your ad accounts through the Prowl MCP, run a cross-channel spend report that pulls normalized data across every connected platform, then enable short-cycle alerting on the metrics that matter most to your account.
What this changes in practice:
- Setup time can drop significantly compared to the days or weeks a custom API integration usually takes, to a single connection session.
- Anomaly detection improves because normalization and cross-channel comparison happen automatically instead of requiring a custom pipeline.
- Agencies managing several client accounts may benefit from having a consistent reporting format instead of rebuilding logic per client.
The first report most teams run is a blended pacing view across every active platform, which surfaces any account already drifting off budget before the next invoice cycle closes.
Using APIs to Pull Spend Data Automatically
Manual exports don’t scale once you’re managing more than two or three ad accounts, and this is where API access becomes the difference between reactive and proactive tracking. Every major ad platform, Google Ads, Meta, LinkedIn, and most programmatic networks, exposes an API that returns spend, impressions, clicks, and conversion data on a schedule you control rather than one dictated by a dashboard’s refresh rate.
The practical setup involves three pieces. First, authenticate against each platform’s API using OAuth or an API key, following that platform’s documentation, since permission scopes and rate limits vary by network. Second, schedule pulls on a cadence that matches your monitoring needs, every 15 minutes for active-spend alerts, daily for historical trend reports. Third, land the raw data in a structured format (a database table or a normalized feed) before any calculation happens, so currency conversion and timezone alignment occur once, consistently, rather than being recalculated differently by each downstream report.
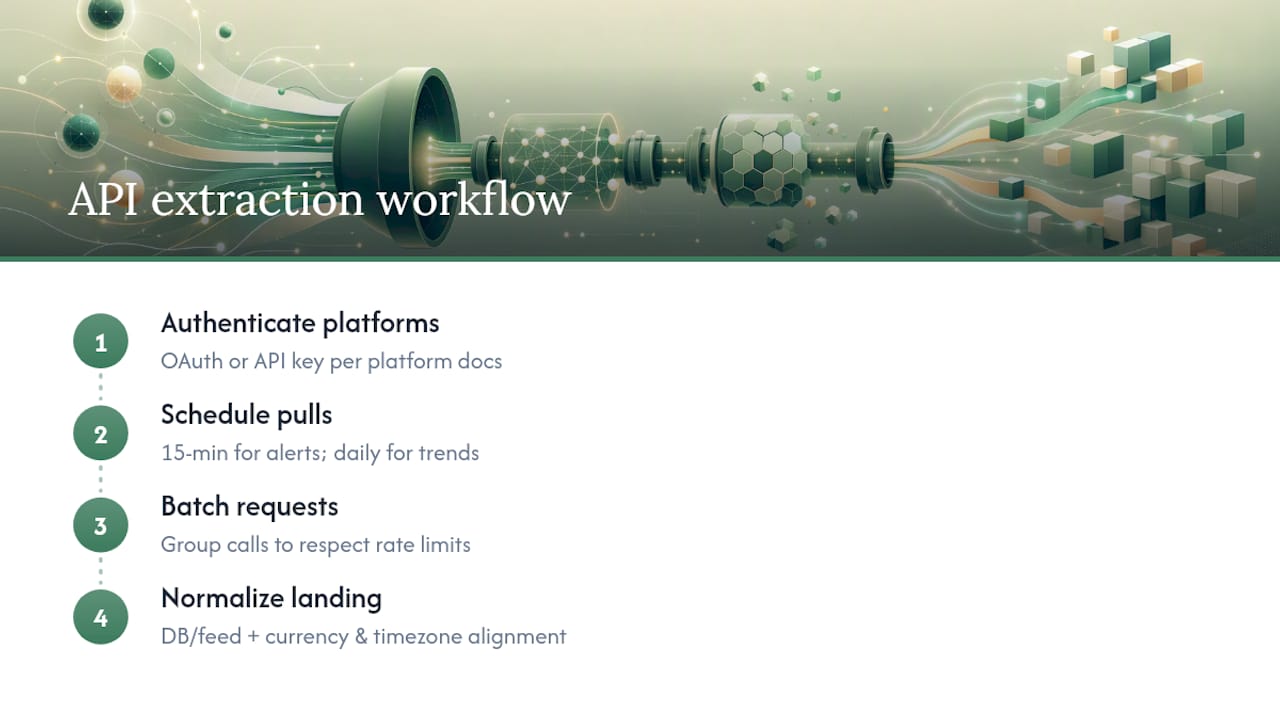
Rate limits are the most common technical snag. Most platforms cap how many API calls you can make in a given window, which means pulling data for 50 accounts every 15 minutes requires batching requests intelligently rather than firing them one at a time. A connector that already handles this batching, rather than a custom script built in-house, removes a maintenance burden that grows every time a platform changes its API version.
Once the extraction is automated, reporting becomes a matter of querying the normalized dataset rather than manually compiling numbers from five different dashboards. That’s the actual payoff of API automation: not just saved time, but a single source of truth that every stakeholder pulls from.
How Data Privacy Rules Affect Ad Spend Tracking
Privacy regulation has quietly reshaped how much conversion detail you can actually attach to spend data, and that has direct consequences for tracking accuracy. Browser-level restrictions on third-party cookies, along with regulations like GDPR in the European Union and various state-level privacy laws in the United States, limit how granularly platforms can report on individual user conversions. The practical effect is attribution gaps: spend data stays accurate, but the conversion side of your ROAS calculation can undercount actual results because some conversions simply aren’t visible anymore.
This changes how you should evaluate metrics on the conversion side. Platforms increasingly rely on modeled conversions, statistical estimates that fill in gaps left by lost tracking signals, rather than pure observed data. Modeled figures are useful, but they carry more uncertainty than directly tracked conversions, which matters when you’re deciding whether a channel’s ROAS dip is real or a reporting artifact.
Compliance also affects how you store and process spend and customer data once it’s aggregated. If your tracking system pulls conversion-level detail alongside spend figures, you need clear data retention policies and consent records for any personally identifiable information that flows through the pipeline. Aggregating spend data alone, without customer-level personal information, carries far less compliance overhead than a system that also stores individual user identifiers.
The safest practical approach is to keep spend tracking and customer-level attribution as separate concerns where possible. Spend and pacing data rarely touches personal information at all, so it can flow through your monitoring system with minimal privacy risk. Conversion-level attribution, where personal data enters the picture, deserves its own review against current regulations in whatever markets your ad accounts serve.

When Automation Makes Sense (and When It Doesn’t)
Automate once you’re running more than two or three platforms, or once a single missed overspend has cost real money or a client relationship. Recurring overruns, finance pressure to explain variance faster, and budgets scaling past what one person can watch manually are the clearest triggers.
Spreadsheets are still fine for a small experiment or a one-off campaign test where the downside of a delayed check is trivial. The mistake is keeping that spreadsheet habit after the account list triples. Automation doesn’t just save time at that point, it protects the client trust that a missed 10 a.m. spike would otherwise cost you.
— Sergey
Get Your First Cross-Channel Spend Report Running Today
Everything covered here, aggregation, normalization, short-cycle alerts, comes down to one practical question: how fast can you actually get it running? Some platforms connect your ad accounts through a single market intelligence connector and provide access to multiple intelligence tools for spend tracking, ad performance analysis, and competitor benchmarking, without building custom API integrations for each platform separately.

The setup is straightforward. Connect your accounts, run a cross-channel report to see where you actually stand today, then enable alerting on the thresholds that matter for your budget size. Explore the use cases to see how agencies and analysts apply cross-channel reporting to their own accounts, or head straight to getting started to connect your first account and run a report before your next billing cycle closes.
Sources
- Programmatic share of digital ad spend worldwide (Statista forecast)
- What Is an ad spend? (And how to calculate it) — AppsFlyer
- Marketers waste about one‑fourth of their budgets — eMarketer
FAQ
How Do I Calculate My Ad Spend?
Sum your platform charges for the campaign period, then subtract any refunds or credits issued during that window, as AppsFlyer’s calculation method outlines. For pacing, divide total spend by the number of campaign days elapsed and compare it against your planned daily budget.
Is a 4 ROAS Good?
A 4x ROAS means you generated $4 in revenue for every $1 spent, and whether that’s good depends entirely on your margin. For a business with tight product margins, 4x might barely break even, while a high-margin service business could be highly profitable at that same ratio, so check ROAS against your margin, not against a universal benchmark. Read Growth Reach Marketing’s explanation of ROAS for a fuller breakdown of how to interpret the ratio against your own cost structure.
What Is a Good Ad Spend?
There’s no fixed dollar figure that counts as “good” ad spend, since it depends on your revenue, margin, and growth goals. A more useful question is whether your spend is pacing against a defined budget and producing a ROAS that beats your break-even threshold, which is exactly what cross-channel tracking is built to surface.
How Do I Check Facebook Ad Spend?
Meta Ads Manager shows spend at the campaign, ad set, and account level directly in its dashboard, updated on roughly a daily cycle. For cross-channel comparison against your other platforms, pull that data via the Marketing API into an aggregated view rather than checking each platform’s dashboard separately.
Can Prowl Track Ad Spend Across Multiple Platforms?
Yes. Prowl connects ad accounts through a single MCP and normalizes spend data across platforms for cross-channel reporting and short-cycle monitoring, without requiring separate custom integrations for each network.