
Real-time SEO reporting gives marketers near-live visibility into search performance, primarily traffic, rankings, and technical health, so teams can catch problems and opportunities within hours instead of weeks. The main payoff is speed of detection and action, not perfect immediacy: Google Search Console and GA4 both carry built-in lag, so “real-time” in SEO means fresher than a monthly export, not instantaneous.
TL;DR:
- Real-time SEO reporting relies on frequent data refreshes from sources like Google Search Console and GA4, with GSC data typically firming up over two days and GA4 updating within hours.
- Essential metrics include clicks, impressions, average position, and click-through rate, with on-site conversions and technical signals monitored weekly to avoid false alarms from slow-moving data.
- Dashboard monitoring is crucial during active campaigns or site changes, while archived reports and snapshots serve strategic review and compliance needs.
- Connecting multiple data sources via automated tools like Prowl MCP reduces setup time and ensures provenance, auditability, and accurate anomaly detection without manual export hassles.
- Proper thresholds should be set based on each metric’s typical variance to prevent alert fatigue, and report timing should align with data refresh cycles for accuracy.
Table of Contents
- What Real-Time SEO Reporting Actually Means
- Which Metrics Actually Belong in a Real-Time SEO Report
- Where the Data Comes From, and How to Keep It Honest
- Dashboards or Scheduled Reports: Picking the Right Cadence
- How to Automate Real-Time SEO Reporting Without Babysitting It
- Report Templates You Can Copy Today
- How to Verify a Number Before You Trust It
- How Prowl Agent Handles Real-Time SEO Reporting
- When to Watch Live and When to Wait for the Snapshot
- Get Real-Time SEO Data Into Your Workflow Without Building Connectors
- Sources
- FAQ
What Real-Time SEO Reporting Actually Means
Most people picture a live dashboard ticking upward like a stock ticker. That’s not quite what happens in SEO. What you actually get is a system that refreshes on a short cycle and flags meaningful changes fast, built on top of data sources that themselves aren’t instant.
There are two distinct delivery modes, and mixing them up causes confusion:
- Live dashboards pull data on a rolling basis (hourly or daily) and show current state, ideal for spotting a ranking crash or a traffic drop the moment it registers.
- Timestamped snapshot reports capture a fixed moment, get archived, and serve as the record you compare against later. Interactive dashboards give near-real-time visibility for monitoring, while scheduled reports and spreadsheets remain better for trend analysis and archived history.
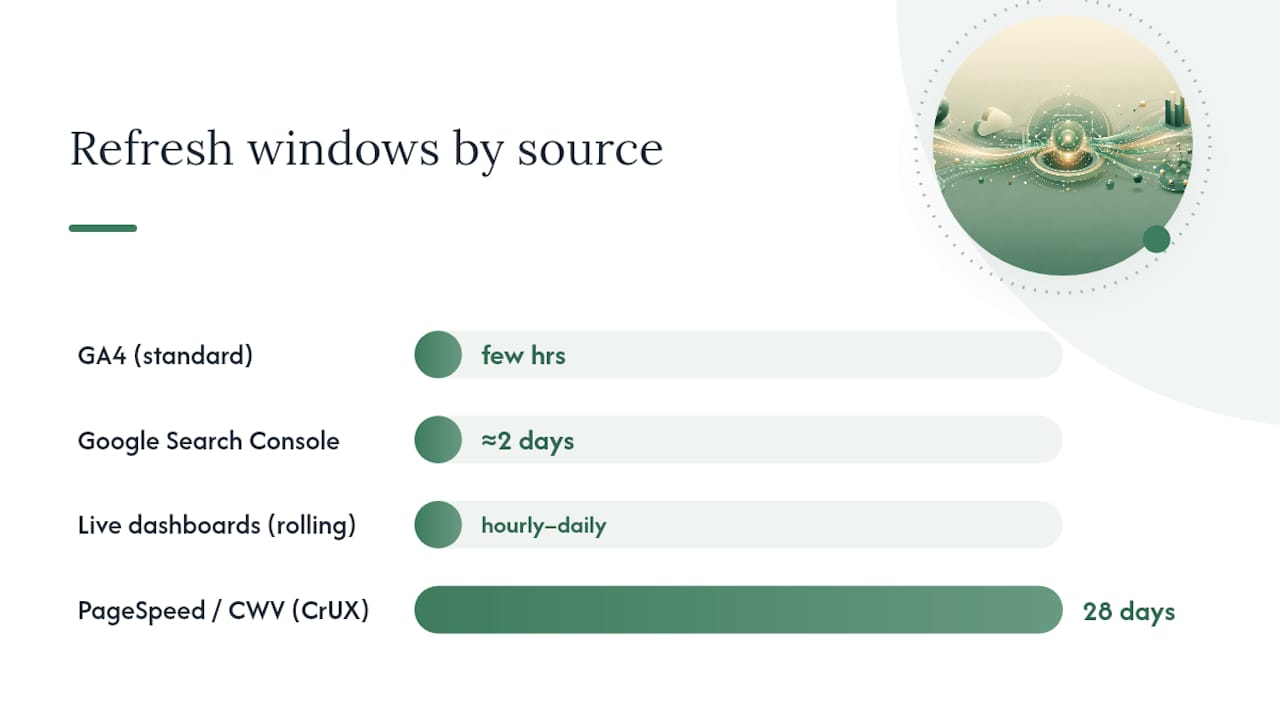
Refresh windows vary a lot by source. Google Search Console data typically firms up over about two days, so anything you see for “today” or “yesterday” in GSC is provisional. GA4 refreshes faster, often within a few hours for standard reports, though certain dimensions process on a delay. PageSpeed Insights and Core Web Vitals field data run on a rolling 28-day window pulled from the Chrome User Experience Report, so a single day’s fix won’t move that number immediately.
That distinction matters for how you use each. A site migration or a sudden spike in 404 errors needs dashboard-level monitoring you check multiple times a day. A month-over-month traffic trend for a client review is a snapshot job. Trying to force live-dashboard urgency onto a metric that only updates weekly just creates false alarms, and trying to run monthly reporting off same-day GSC numbers produces numbers that quietly get revised out from under you.
Which Metrics Actually Belong in a Real-Time SEO Report
Not every metric deserves a spot on a live dashboard. Some move too slowly to matter hour by hour; others are exactly the ones that catch a problem while it’s still small. Essential SEO metrics worth tracking consistently include organic traffic, keyword visibility, click-through rate, conversions, and technical health signals, and the trick for real-time reporting is choosing which of those belong on the live feed versus the monthly review.
Search performance metrics come first because they’re the earliest warning system:
- Clicks and impressions, grouped by query and by page, reveal whether a drop is demand-side (fewer impressions, meaning visibility fell) or friction-side (impressions steady, clicks fell, meaning something in the SERP got less appealing).
- Average position, tracked at the query level rather than site-wide, since a site-wide average can mask a single high-value keyword sliding from position 3 to position 11.
- Click-through rate by page, which flags title tag or snippet problems faster than rankings alone.
On-site behavior and conversions close the loop between visibility and revenue. GA4 events tied to organic sessions, conversion rate by landing page, and assisted conversions from organic search tell you whether a ranking win is actually worth anything. A page that gained impressions but shows flat GA4 conversions is a different problem than a page that lost both.
A gap worth flagging: teams that only watch rankings often miss the fact that a page can hold position while its actual click-through and conversion performance quietly erodes, usually because a competitor improved their snippet or a SERP feature pushed organic results down the page.
Technical metrics round out the report: Core Web Vitals (LCP, INP, CLS), HTTP status code distribution, and indexation status from GSC’s Index Coverage report. These move slower than clicks or impressions, so checking them daily is usually overkill. Weekly is typically enough unless you just shipped a major site change.
Finally, tailor the list by audience. Executives want three numbers: traffic trend, conversion trend, and a one-line flag if something’s broken. Managers want top movers by page and query. Analysts want the raw data with provenance links so they can verify or dig deeper. Sending the same 40-row spreadsheet to all three groups is how reports stop getting read.
Where the Data Comes From, and How to Keep It Honest
Four sources cover most of what a real-time SEO report needs, and each one has a different refresh rhythm and a different failure mode.
- Google Search Console supplies queries, clicks, impressions, position, and indexation status, but its data typically firms up over roughly two days, so treat the last 48 hours as provisional.
- GA4 contributes sessions, events, and conversions tied to organic traffic, with faster refresh but its own sampling quirks on high-traffic properties.
- PageSpeed Insights and the Chrome UX Report supply Core Web Vitals on a rolling 28-day field-data window, useful for trend tracking, not same-day fixes.
- Server logs show what search engine crawlers are actually doing, crawl frequency, response codes, wasted crawl budget, which none of the above three surface directly.
Automated reporting tools commonly connect to Search Console, GA4, and PageSpeed Insights through read-only OAuth connections, then output the combined data as scheduled PDFs or live share links. Read-only OAuth is the right permission level for almost every use case; there’s rarely a reason to grant write access to a reporting connector. Vendor privacy documentation, like Microsoft Clarity’s privacy page, is a useful model for how to disclose what a connected account can and can’t touch when you’re documenting governance for stakeholders.
The single biggest trust-builder in any automated report is provenance: a visible note on each number explaining where it came from and when it was pulled. Attaching a “how was this computed” link to each figure is what makes automated numbers defensible when a client questions them, and it costs almost nothing to build in from the start.

Three pitfalls show up constantly. API rate limits throttle pulls on high-volume accounts, especially GSC’s daily query quota. GA4 sampling kicks in on high-traffic properties viewing long date ranges, quietly changing your numbers depending on how you query them. And permission errors, an expired OAuth token, a removed user, a property migration, are the number one cause of a “why did this report go blank” support ticket.
Pro Tip: Log every connector pull with a timestamp and a source label, even if your dashboard doesn’t display it by default. When a client asks “why does this number look different from last week,” you want the answer in five seconds, not twenty minutes of digging through export history.
Dashboards or Scheduled Reports: Picking the Right Cadence
The two formats solve different problems, and most teams that feel overwhelmed by reporting are actually just using the wrong one for the job.
Always-on dashboards earn their keep for monitoring and anomaly detection: a traffic cliff, a spike in 404s after a deploy, a sudden CTR drop that suggests a SERP feature change. You want eyes on this daily, sometimes hourly during a migration. Scheduled snapshot reports earn their keep for anything that needs a defensible, archived record: monthly client deliverables, quarterly business reviews, audit trails you might need to reference six months later.
A workable cadence looks like this:
- Daily or twice-daily: internal dashboard checks during active campaigns, migrations, or algorithm update windows.
- Weekly: technical health check (Core Web Vitals, crawl errors, indexation status).
- Monthly: full client-facing snapshot report, archived and versioned.
- Quarterly: strategic review comparing trend lines across the previous three monthly snapshots.
Format the output differently for each audience. An executive rollup should fit on one screen: three to five headline numbers, one sentence of context each, and nothing else. A manager view drills into top-performing and worst-performing pages and queries. An analyst view needs the raw movers list with provenance links attached, because that’s the version someone will actually fact-check.
How to Automate Real-Time SEO Reporting Without Babysitting It
Manual reporting dies the same way every time: someone exports a CSV, pastes it into a spreadsheet, formats a chart, and repeats that on a deadline every week until they quit or automate it. The fix is a repeatable pipeline, not a smarter spreadsheet.
The high-level flow has four stages:
- Connectors pull data from Search Console, GA4, PageSpeed Insights, and server logs on a schedule matched to each source’s actual refresh rate, not a single arbitrary interval for everything.
- Normalization reconciles naming conventions and date windows across sources, since GSC and GA4 don’t always define “session” or “click” the same way.
- Anomaly detection flags changes that cross a meaningful threshold, a ranking drop of more than five positions, a traffic swing beyond normal variance, a spike in 5xx errors, rather than surfacing every minor fluctuation.
- Delivery pushes the finished report to the right channel: a live link for internal monitoring, a scheduled PDF for a client, or a webhook alert for something urgent enough to page someone.
Four template elements are worth automating first because they cover 80% of what people actually read: a top-movers list (biggest gains and losses by page or query), a KPI rollup against the prior period, anomaly flags with a plain-language explanation, and a short action list translating the numbers into next steps.
Delivery format should match urgency. Live share links suit ongoing internal monitoring where the audience wants to check in whenever. Scheduled PDFs suit client relationships that expect a predictable, brandable deliverable. Report generators built for agencies now commonly produce a formatted PDF in well under a minute, which removes most of the manual assembly time that used to eat an afternoon. Webhook alerts belong at the top of the urgency ladder, reserved for the handful of anomalies serious enough to interrupt someone’s day.
Pro Tip: Build your anomaly thresholds around the noise level of each specific metric, not one blanket percentage for everything. The same swing on your top revenue page deserves an immediate look.
Before picking a tool or building a connector yourself, run through a short checklist: Does it show provenance on every number? Does it handle the connector volume your account list actually needs, not just a demo-sized sample? Does it cover all four core sources, or will you be stitching in a manual workaround for logs or PageSpeed data? And does it respect the API rate limits of each source without silently dropping data when it hits a ceiling?
Report Templates You Can Copy Today
A good template survives contact with a real client meeting. Here’s a structure that holds up across audiences.
The executive one-pager leads with three to five numbers: organic traffic trend, conversion trend, and a single flagged issue if one exists. No charts with more than one line, no jargon, no query-level detail. Executives read this in under thirty seconds, and that’s the point.
The manager dashboard goes one layer deeper:
- Top 10 pages by organic traffic change, with direction and magnitude.
- Top 10 queries by position change, filtered to exclude branded search noise.
- Conversion rate by landing page, organic segment only.
- A technical alerts panel showing anything currently flagged (Core Web Vitals failures, crawl errors, indexation drops).
The analyst view is the working document. It carries the raw movers list with no filtering applied, provenance links on every figure showing exact pull time and source, and a note on the date window used for each comparison, since “last 28 days” versus “last calendar month” produces different numbers for the same underlying data.
Version every report you send. Save it with a date stamp, keep the underlying export archived, and never overwrite a prior snapshot. The real distinction between vendors marketing “real-time” reporting often comes down to whether the system preserves dated, auditable snapshots rather than just showing a live number that changes underneath you. Six months from now, when someone asks why a metric looked different in March, that archive is the only thing that saves you.
How to Verify a Number Before You Trust It
Speed is worthless if the number is wrong. A short verification habit catches most problems before they reach a client.
Start with the lag itself. Search Console data firms up over roughly two days, so scheduling monthly snapshots a few days after month-end avoids the false cliff that shows up when the last day or two of provisional data looks artificially low.
- Treat any single-day swing under 10% as likely noise unless it lines up with a known event (deploy, algorithm update, seasonal pattern).
- Cross-check a suspicious GA4 number against Search Console’s own click count for the same date range; a large mismatch usually points to a tagging or sampling issue, not a real traffic event.
- Confirm the property and date window match across every source before comparing them.
- If a snapshot report needs to go out right after month-end, hold it two to three extra days rather than shipping numbers you know will still shift.
How Prowl Agent Handles Real-Time SEO Reporting
Most of the workflow above, connectors, normalization, anomaly flags, delivery, is exactly what Prowl Agent was built to handle. Prowl connects any AI agent to 448 market-intelligence tools through a single MCP, replacing the usual pattern of wiring up separate integrations for search data, ad performance, and competitor tracking one at a time.
That single-connector setup is what lets an agent pull real-time analytics across SEO and ad performance without the setup overhead each individual tool normally demands. Instead of stitching together a GSC connector, a GA4 export, and a PageSpeed script by hand, an agent working through Prowl MCP can generate a synthesized report pulling from multiple providers in one pass, with the kind of cross-referenced output that would otherwise take a manual analyst several separate exports to assemble.
When to Watch Live and When to Wait for the Snapshot
Not every metric earns a place on a live dashboard. High-velocity signals, crawl errors after a deploy, a sudden ranking cliff, a traffic drop tied to an algorithm update, deserve hourly or daily eyes. Low-velocity signals like backlink growth or long-tail keyword trends barely move day to day, and checking them constantly just produces noise dressed up as insight.
Alert fatigue kills real-time reporting faster than bad data does. Set thresholds around each metric’s actual variance, not a single number for everything.
The practical answer isn’t choosing one approach. Run dashboards for anomaly detection and reserve scheduled, archived snapshots for anything you’ll need to defend later. Live data catches the fire. Snapshots prove what happened after you put it out.
— Sergey
Get Real-Time SEO Data Into Your Workflow Without Building Connectors
If you’ve read this far, you already know the hard part of real-time SEO reporting isn’t the dashboard, it’s wiring up and maintaining connectors to Search Console, GA4, PageSpeed Insights, and everything else without it becoming a part-time job. Prowl Agent replaces that setup work with one MCP connection that gives any agent access to 448 intelligence tools at once, so an agent can pull SEO, ad performance, and competitor data in a single workflow instead of juggling separate integrations for each source.

Pricing runs through four plans, Recon, Exploit, Blackops, and Syndicate, alongside prepaid credit packs starting at $10 for smaller one-off pulls. If you’re running Claude or Cursor as your agent of choice, Prowl also ships dedicated connectors for Claude and Cursor. Check the pricing page for current plan details, or head to getting started to connect your agent and run your first report today.
Sources
Key sources: AnalyzeData, Reportr, SEOptimer, WeAreTG, and AuthorityLayer on AI Search measurement.
- SEO Reporting Software & Report Generator | AnalyzeData
- Automated SEO Report Generator | Reportr
- Automated SEO Reports - SEOptimer
- SEO Reporting Essentials: The Ultimate Guide
FAQ
Is SEO Still Relevant in 2026?
Yes. Organic search still drives a large share of qualified traffic for most businesses, and real-time reporting has actually become more valuable, not less, as algorithm updates and AI-driven search features change results faster than they used to. The skill that’s shifted is measurement: teams now need to track visibility across traditional search and AI-powered surfaces, which is where AI-assistant measurement frameworks come in.
Can ChatGPT Do an SEO Audit?
ChatGPT can analyze content, suggest technical fixes, and interpret data you feed it, but it can’t pull live Search Console, GA4, or PageSpeed data on its own without a connector. Tools that connect an AI agent to real analytics sources, like Prowl’s MCP setup, close that gap by giving the agent direct, read-only access to the actual accounts.
What Is the Best Tool for SEO Reporting?
There’s no single best tool; the right choice depends on whether you need live dashboards, scheduled client PDFs, or agent-driven automation across multiple data sources. Automated report generators that connect to Search Console, GA4, and PageSpeed Insights cover the basics, while platforms like Prowl extend that further by connecting an agent to 448 intelligence tools for broader competitive and market reporting in one workflow.
Can Yoast Perform Real-Time Content Analysis?
Yoast SEO analyzes content in real time as you write, checking readability, keyword usage, and basic on-page signals within your CMS editor. It doesn’t pull live ranking, traffic, or Search Console data, so it complements a real-time reporting setup rather than replacing one.
How Often Should a Real-Time SEO Dashboard Refresh?
Match the refresh rate to the source: GA4 data can update within hours, while Search Console figures need about two days to firm up, so pulling GSC numbers more than once a day rarely adds accuracy. A practical setup refreshes GA4 and server log data daily and treats GSC’s most recent 48 hours as provisional.