
Marketing ETL, in the sense that matters for procurement teams today, is a market-intelligence connector (MCP) that pulls data from dozens of marketing tools and synthesizes it into automated, agent-driven reports through one API. It is not a warehouse pipeline. Adopt one the moment your team spends more time copying numbers between platforms than acting on them, and pick a connector like Prowl MCP when you need repeatable SEO, ad, or competitor reports without hiring a data engineer.
TL;DR:
- Marketing ETL focuses on fast, repeatable reports by connecting to hundreds of tools through one API, avoiding the need for data warehouses.
- It uses asynchronous job patterns with quotas and request hygiene to ensure reliable, timely, and accurate data delivery.
- Labeling data freshness and attribution revision windows builds stakeholder trust and prevents misleading decisions.
- Running small pilots across three report types helps evaluate if the connector can meet expectations for speed, coverage, and freshness disclosures.
- Building or maintaining multiple individual integrations often costs more in engineering time than using a single connector like Prowl MCP, which handles 448 tools.
Table of Contents
- What Marketing ETL Actually Means for an MCP Buyer
- Who Actually Needs This and Why
- How Do You Build a Reliable Automated Report Pipeline?
- What Makes an Automated Report Trustworthy?
- Where Prowl MCP Fits and How to Pilot It
- How Do You Catch Bad Data Before It Reaches a Client?
- What Security Standards Should a Marketing Data Pipeline Meet?
- How Do You Know a Marketing ETL Job Is Actually Healthy?
- How Are Teams Wiring Marketing ETL Into Real Workflows?
- What Should You Budget for a Marketing ETL Pipeline?
- What Actually Goes Wrong When Teams Adopt This
- Get Started With Prowl MCP for Automated Marketing Reports
- Where to Go Deeper on the API Fundamentals
- Sources
- FAQ
What Marketing ETL Actually Means for an MCP Buyer
Forget the warehouse definition for a moment. A marketing ETL connector, as agencies and growth teams now use the term, is a single API that reaches into your SEO tools, ad platforms, review sites, and competitor trackers, then hands an AI agent structured data it can turn into a finished deliverable. You are not loading tables into Snowflake or BigQuery. You are asking a connector to fetch, cross-reference, and package.
The output is the point. A well-built marketing ETL connector produces a PDF brief, an interactive dashboard, a PPTX deck for a client meeting, an infographic for social, or even an audio or video summary for a stakeholder who will not read a report. Prowl MCP works this way: one connector, 448 tools, and a synthesis layer that turns raw API responses into something a human can act on the same day.
If your task is normalizing years of historical data for a business intelligence team, that is a different project with different tools. This is about speed and repeatability for people who need answers this week, not a data lake.
Who Actually Needs This and Why
Four buyer profiles show up again and again, and each one has a different pain point that a marketing ETL connector solves directly.
Agencies run the same SEO audit, the same competitor teardown, and the same ad performance recap for every client, every month. Doing that by hand across five tools per client does not scale past a handful of accounts. Growth teams need a competitive snapshot before a planning meeting, not a week from now. Product managers want a market trend read before a roadmap review, and they usually need it once, fast, not as an ongoing subscription to five separate tools. Business analysts get asked to “pull together everything we know” about a segment or a rival, which in practice means manually stitching data from six dashboards into a slide deck.
A connector approach shortens all four jobs because it removes the integration tax. Instead of building and maintaining separate API connections to a dozen SEO, ad, and review platforms, you configure one connection and let the agent decide which tools to call for a given brief.
When you evaluate any marketing ETL setup during procurement, measure it against these outcomes:
- Time-to-report: how long from request to finished deliverable, not just raw data
- Data freshness: whether the report tells you how current the numbers actually are
- Reproducibility: can you rerun the same report next month and trust the methodology stayed consistent
- Coverage: does one connector reach the tools your team already relies on, or do you still need three subscriptions
How Do You Build a Reliable Automated Report Pipeline?
Automated reports fail in boring, predictable ways: a job that looks stuck, a quota that gets blown halfway through a batch, a request that times out because it asked for too much at once. None of that is exotic. It is standard API engineering, and the fixes are well documented.
Start with the asynchronous pattern almost every serious reporting API uses. You submit a job, save the ID it returns, then either poll on an interval or wait for a completion callback. Never assume a report comes back instantly, especially one that cross-references several data sources, because upstream data readiness (not the request itself) is usually the slow part. Google’s own analytics documentation is built around exactly this pattern.
- Submit the job and store the returned ID. Treat it as the only reliable reference to that specific report run.
- Poll every 30 to 60 seconds, or register a completion callback if the connector supports one. Callbacks cut wasted requests and get you the result the moment it is ready.
- Design for a real state machine: queued, running, partial, completed, failed. A report stuck between “running” and “complete” for ten minutes is not necessarily broken; it might just be waiting on a slow upstream source.
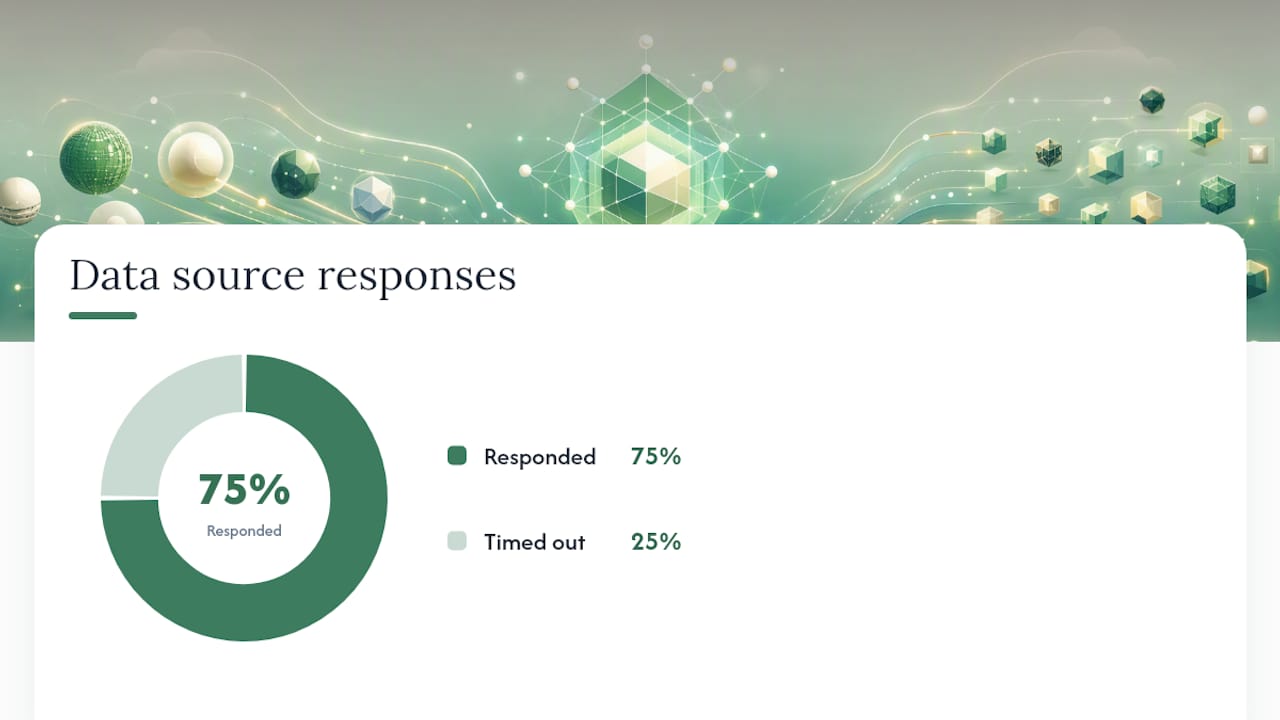
- Surface partial results instead of hiding them. If three of four data sources responded and one timed out, tell the requester which three, not just that “something went wrong.”
- Track quota consumption actively. Google Analytics Data API quotas vary by property and request complexity, and burning through them mid-batch kills a whole reporting run, not just one report.
Quota-aware orchestration means more than watching a dashboard. Limit concurrency so you are not firing twenty simultaneous report jobs against a connector with a hard ceiling. Use quota-return features like returnPropertyQuota where the API offers them so your system knows how close it is to a limit before it hits one. Build retry logic with backoff, not blind resubmission.
Request hygiene matters just as much. Advertising APIs in particular punish greedy requests. LinkedIn’s ads reporting guidance recommends requesting only the fields you actually need, paginating large pulls, and breaking oversized requests into smaller bundles rather than one massive call that risks throttling.
Pro Tip: Build your job state machine before you build your first report template. Teams that skip this end up bolting error handling onto a system that assumed everything would always succeed on the first try, which is the single most common rebuild trigger in year one.
What Makes an Automated Report Trustworthy?
A report nobody trusts is worse than no report. The fastest way to lose that trust is to hand someone a number without telling them how current it is or where it might still change.
Label freshness on every dataset, every time. Realtime data is typically available within minutes. Intraday data usually lands within 2 to 6 hours. Daily data can take 12 hours or longer to fully process, depending on the size of the property behind it. A report that mixes all three without saying so is quietly misleading whoever reads it.
Attribution needs its own disclosure. Modeled attribution can keep revising for up to 12 days after an event happens. A campaign performance number that looked strong on day two might look different on day fourteen, and a report that does not flag this invites someone to make a decision on data that is still settling.
The freshness gap is the trust gap. A daily-refresh report delivered as if it were realtime is the single fastest way to make a stakeholder distrust every subsequent report you send them, even after the pipeline is fixed.
Define metric bundles instead of letting every report request every available field. A “summary” bundle, an “audience breakdown” bundle, and a “campaign performance” bundle each serve a different reader and a different question. Avoid high-cardinality dimensions by default. Breaking a report down by every URL, every keyword, and every geography at once inflates token consumption and slows the job for a level of detail most readers will not use anyway. Long date ranges carry the same tradeoff: more history means more processing and a higher chance of hitting a rate limit.
Every deliverable, whatever format it takes, PDF, interactive dashboard, or PPTX, should carry provenance: which sources fed it, when they were pulled, and a short changelog noting anything that changed since the last version. That single addition does more for stakeholder confidence than any amount of visual polish.
Where Prowl MCP Fits and How to Pilot It
Prowl MCP is built around the single-connector idea rather than a stack of point integrations. One connection gives an agent access to 448 marketing intelligence tools, covering SEO, ad performance, competitor tracking, and review analysis, and it can hand back a PDF, an interactive report, a PPTX deck, an infographic, or an audio or video summary depending on what the requester actually needs.
A short pilot tells you more than a sales call ever will. Run three report types and measure what matters before committing budget:
- An SEO brief for one account, checked against a manual version you already trust
- A cross-channel ad performance summary pulling from at least two platforms
- A competitor snapshot comparing pricing, positioning, or review sentiment
Track time-to-report against your current manual process, watch quota usage under real load, and confirm the deliverables actually label freshness and disclose attribution revision windows the way they should. If a connector cannot tell you whether a number is realtime or twelve hours stale, that is a disqualifying gap, not a minor detail.
How Do You Catch Bad Data Before It Reaches a Client?
Marketing data pipelines break in specific ways: a metric definition shifts between platform updates, a rate-limited request returns a partial payload that looks complete, or a field gets renamed upstream and silently starts returning nulls. None of these throw a dramatic error. They just quietly corrupt the report.
Validate at the boundary, not at the end. When a connector pulls from a dozen sources, check each response individually before merging anything: does the row count look plausible, are required fields present, does a metric that should never be negative come back negative. Catching a bad response from one provider before it gets blended into a synthesized report is far cheaper than explaining a wrong number to a client after delivery.
Schema drift is the quiet killer. Marketing platforms update their reporting APIs regularly, sometimes renaming a field or changing what a metric includes without much warning. A pipeline that assumes yesterday’s schema will silently produce wrong totals rather than crashing, which is worse. Version your field mappings and flag anything unexpected rather than passing it through.
When a provider times out or returns an error, the honest move is to say so in the deliverable. A report that quietly drops a source and presents the remaining data as the full picture is a bigger liability than one that says “Provider X did not respond in time; this report reflects the other three sources.” That single line of transparency, tied to the partial-results state discussed earlier, is what separates a pipeline you can defend to a client from one you are hoping nobody audits too closely.
What Security Standards Should a Marketing Data Pipeline Meet?
Marketing data is not medical or financial data, but it is not harmless either. Ad account access tokens, customer segment definitions, and competitor pricing pulls all carry real business risk if they leak or land in the wrong hands.
Credential handling is the first line of defense. API keys and OAuth tokens for ad platforms and analytics tools should never sit in plain text in a report template or a shared spreadsheet. Rotate tokens on a schedule, scope them to the minimum permissions a report actually needs, and revoke access immediately when a client relationship or a team member’s role ends.
Data residency and retention deserve a real policy, not an assumption. If a report pulls customer-level ad audience data, decide up front how long that data lives in your pipeline, where it is stored, and who can access it after the report ships. Agencies handling data across multiple client accounts need clear separation between them; a report generation error that leaks one client’s competitor analysis into another client’s deliverable is the kind of mistake that ends contracts.
Compliance obligations vary by the type of data a connector touches and by the jurisdiction of the business it serves, so a single blanket policy rarely covers every case. A pipeline touching EU-based ad audiences carries different obligations than one touching only aggregate keyword ranking data. Build your validation and access-logging practices to the strictest standard your data mix requires, and confirm with counsel where the answer genuinely depends on your specific setup rather than guessing.
How Do You Know a Marketing ETL Job Is Actually Healthy?
A pipeline that runs silently until it breaks is a pipeline you find out about from an angry client, not from your own dashboard. Monitoring for marketing ETL jobs needs to answer three questions constantly: is it running, is it fast enough, and is the data it’s producing actually correct.
Track job completion rates and latency per source, not just for the pipeline as a whole. If one advertising platform’s connector starts failing 10% of the time while the other nine sources stay healthy, an aggregate “99% success rate” metric hides the problem. Break monitoring down by provider so a degrading connection surfaces before it drags down every report.
Alert on quota consumption trends, not just quota breaches. A team that only gets paged after hitting a rate limit has already lost that report run. Watching consumption climb toward 80% of a documented quota, the kind Google Analytics publishes for its Data API, gives you time to throttle or reschedule before anything fails.
Set up freshness alerts separately from failure alerts. A job can complete successfully and still return data that is staler than the report promises, especially if an upstream source is having a slow day without technically eroding out. Comparing the “last processed” timestamp against your labeled freshness standard catches that gap before a stakeholder does.
Finally, alert on partial-result frequency. If a particular data source is contributing incomplete responses three times a week, that is a pattern worth investigating, not a series of unrelated one-off incidents.
How Are Teams Wiring Marketing ETL Into Real Workflows?
The most common automation pattern looks like this: a scheduled trigger, usually weekly or monthly, kicks off a job through the connector’s API, the agent pulls from the relevant tools, synthesizes the result, and drops the finished deliverable into wherever the team already works, Slack, a shared drive, or a client portal.
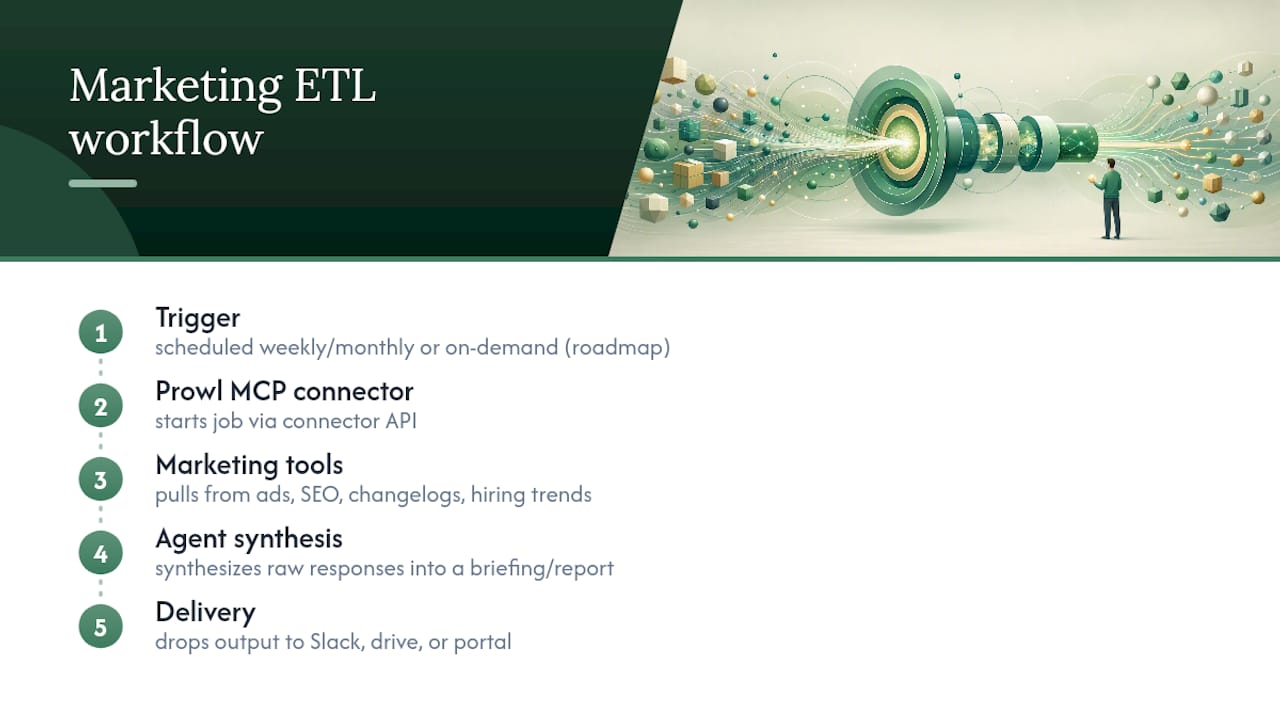
Agencies running recurring SEO audits often chain this to a calendar trigger tied to each client’s billing cycle, so the report lands a day before the monthly check-in call without anyone manually kicking off the job. Growth teams building competitive intelligence briefings sometimes pair a marketing ETL connector with a research agent that also pulls product changelog data or hiring trends, producing a broader market snapshot than ad and SEO metrics alone would give. Open-source patterns for this kind of agent-driven competitive intelligence workflow show the general shape: a planning step, a data-gathering step across multiple providers, and a synthesis step that turns raw responses into a briefing document.
Product teams tend to use a lighter version: an on-demand trigger tied to a roadmap review, pulling a market trend snapshot only when someone actually needs it rather than on a fixed schedule. Business analysts often sit in the middle, taking connector output and feeding it into an existing BI tool or slide template rather than treating the connector’s native format as the final deliverable.
The pattern that works across all four: keep the trigger simple, keep the job state visible, and let the connector’s output format match how the recipient actually consumes information, a Slack summary for a quick check, a full PPTX for a client meeting.
What Should You Budget for a Marketing ETL Pipeline?
Cost in this category comes from two places: the connector or API subscription itself, and the engineering time to build and maintain the orchestration around it. Most teams underestimate the second one.
A metered, credit-based model tends to fit teams with unpredictable reporting volume better than a flat subscription, because a slow month does not force you to pay for capacity you did not use. A monthly subscription tends to fit teams running a steady, predictable cadence of reports, since the per-report cost drops as volume goes up. Either way, model your cost against report volume, not against seats or users, since that is what actually drives API consumption.
Do not overlook the maintenance cost of building your own connectors. Every individual integration to an SEO tool, an ad platform, or a review site needs its own auth handling, schema mapping, and error handling, and every one of those breaks independently when the upstream provider changes something. A single-connector approach shifts that maintenance burden away from your engineering team, which is often the larger hidden cost in a DIY pipeline once you count the hours spent debugging a broken integration nobody budgeted time for.
Factor in the cost of report failures too. A pipeline that produces a wrong or stale number for a client isn’t just a technical bug, it’s a credibility cost that shows up later as a lost renewal.
What Actually Goes Wrong When Teams Adopt This
The failures I keep seeing are procedural, not technical: teams ignore quotas until a batch job dies mid-run, they request every metric available instead of building focused bundles, and they hide partial results instead of disclosing them. What works is smaller and less exciting: start with one report type, watch your quota dashboard from day one, prefer callbacks over polling wherever the connector allows it, and put freshness labels in front of the reader instead of burying them in a footnote. The pilot checklist above is where to start proving that out.
— Sergey
Get Started With Prowl MCP for Automated Marketing Reports
Building your own connectors to a dozen marketing tools costs engineering time most agencies and growth teams do not have to spare. Prowl Agent replaces that work with one connection to 448 marketing intelligence tools, covering SEO, ad performance, competitor analysis, and review data, so your team ships reports in the format a stakeholder actually wants: PDF, interactive dashboard, PPTX, or a quick audio summary.

Prowl Agent’s plans run from Recon, Exploit, Blackops, up to Syndicate, alongside metered credit packs for teams that prefer pay-as-you-go usage over a fixed subscription. Full details sit on the pricing page.
If you are evaluating this for a team, start small. Run a 30-day pilot against three report types, an SEO brief, an ad performance summary, and a competitor snapshot, and check the use cases page for examples that match your reporting needs. During the pilot, confirm the deliverables label data freshness clearly, show you quota consumption in real time, and disclose attribution revision windows rather than presenting every number as final. Setup instructions for connecting your agent live on the getting started guide.
Where to Go Deeper on the API Fundamentals
Before running an enterprise pilot, read the primary documentation your pipeline will depend on: Google’s data freshness and quota guidance, the Data API quota reference, and LinkedIn’s ads reporting rules on field selection and throttling. For broader strategy context, West Valley Digital’s marketing blog covers tactical SEO framing useful for designing report bundles.
Sources
FAQ
What Is Marketing ETL in This Context?
Marketing ETL here refers to a market-intelligence connector, or MCP, that extracts data from many marketing tools and synthesizes it into automated reports through one API. It is distinct from warehouse-style ETL that loads data into systems like BigQuery or Redshift.
How Is a Marketing ETL Connector Different From Building My Own Integrations?
A connector like Prowl MCP gives you access to 448 marketing intelligence tools through one API instead of building and maintaining separate connections to each platform. That removes the ongoing maintenance burden of updating individual integrations every time a source platform changes its API.
Should I Use Polling or Callbacks for Long-Running Reports?
Use a completion callback when the connector supports one, since it avoids wasted requests and returns results the moment they are ready. Fall back to polling every 30 to 60 seconds, following the asynchronous job pattern most reporting APIs use.
How Current Is the Data in an Automated Marketing Report?
It depends on the labeled freshness tier: realtime data is typically available within minutes, intraday within 2 to 6 hours, and daily data can take 12 hours or longer. Attribution figures can keep revising for up to 12 days after an event, so any report should disclose which tier applies to each dataset.
What Does Prowl MCP Cost?
Prowl Agent offers subscription plans at $60, $120, and $240 per month (Exploit, Blackops, and Syndicate), plus metered credit packs of $10, $50, and $200 for pay-as-you-go usage. Full pricing details are on the pricing page.