
Market trend analysis is the practice of tracking directional movement in market data across multiple sources over time, so you can act before a shift becomes obvious to everyone else. The payoff is straightforward: better timing on product bets, pricing moves, and market entry, with less guesswork. If you’re staring at a decision right now, the fastest useful step is a scoped trend scan tied to that one question, not a sweeping market study.
TL;DR:
- Most steady market shifts are long-term and show consistent signals across multiple regions and channels, unlike short-term spikes that can be seasonal or isolated.
- Using dimension-based segmentation and seasonality decomposition helps distinguish genuine structural trends from temporary or seasonal fluctuations.
- Running trend validation steps every two weeks, rather than quarterly, allows businesses to catch inflection points earlier and act faster.
- Combining quantitative data like sales, search demand, and platform analytics with qualitative insights from customer feedback and social content provides a fuller picture of trends.
- Automated, integrated tools like Prowl streamline data collection and validation, reducing the time from trend detection to strategic action.
Table of Contents
- What Is Market Trend Analysis, and How Is It Different From Forecasting?
- Why Should Leaders Prioritize Market Trend Analysis?
- What Types of Market Trends Should You Track?
- How Do You Perform Market Trend Analysis Step by Step?
- Which Analytical Methods Actually Prove a Trend Is Real?
- What Tools Belong in a Market Trend Analysis Toolkit?
- How Do You Turn a Validated Trend Into a Business Decision?
- What Do Real Trend Analysis Cases Look Like?
- Who’s Behind This Kind of Analysis, and Does the Tooling Hold Up?
- What Actually Breaks Trend Programs Inside Companies
- How Prowl Fits Into Your Trend Analysis Workflow
- Sources
- FAQ
What Is Market Trend Analysis, and How Is It Different From Forecasting?
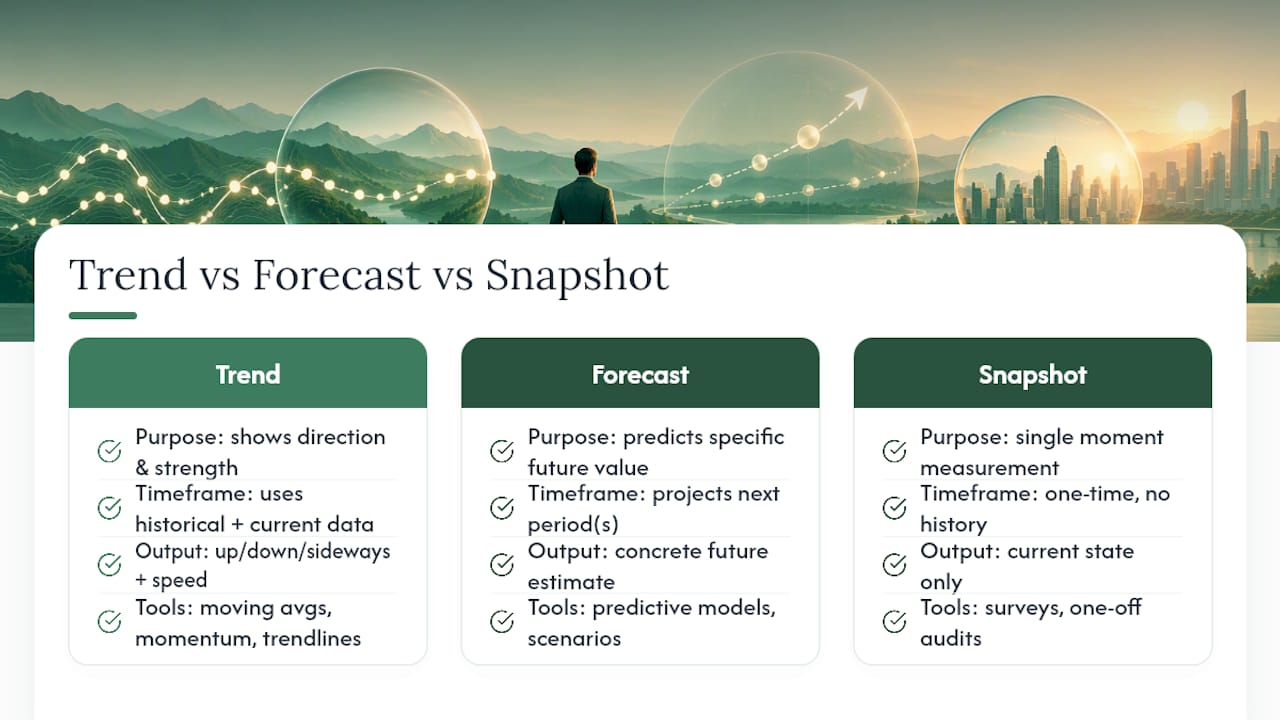
Market trend analysis reads direction. It looks at historical and current market data, whether that’s sales figures, search demand, or pricing shifts, and tells you whether something is moving up, down, or sideways, and how fast. Trend analysis traditionally relies on tools like moving averages, momentum indicators, and trendlines to make that direction visible instead of buried in noise.
That’s a different job than forecasting. Forecasting tries to predict a specific future value, next quarter’s revenue, next year’s unit sales. Trend analysis tells you which way things are pointed right now and how strong that movement is. You need both, but they answer different questions, and mixing them up is where a lot of strategy decks go wrong.
Snapshot research is a third, separate thing. A single survey or one-time competitive audit gives you a moment in time. It can’t tell you if a number is climbing, falling, or holding steady, because it has no history to compare against. Trend analysis is what you reach for when the decision hinges on momentum: is this market entry window opening or closing? Is customer sentiment recovering or still sliding? Those are trend questions, not snapshot questions.
Why Should Leaders Prioritize Market Trend Analysis?
Trend evidence sharpens the decisions that depend on timing. Product roadmap prioritization, market entry sequencing, positioning language, and capacity planning all get better when you know direction and speed, not just a static number.
Consider capacity planning. A company that sees rising demand velocity in early data can lock in supplier capacity before competitors notice the same signal. One that waits for a quarterly report to confirm the obvious pays a premium, or loses the window entirely.
The real cost of skipping trend work isn’t a bad decision. It’s a late one. Teams that rely on annual market reports often act on data that’s already six to twelve months stale, reacting to a trend that has already peaked. Cross-source validation before committing resources catches these lagging signals before they cost you a launch cycle. The businesses that build trend monitoring into a regular cadence catch inflection points months earlier than those running research as an occasional project.
What Types of Market Trends Should You Track?
Not every upward line on a chart means the same thing. Treating a two week spike the same way you’d treat a two year shift is one of the most common analytical mistakes decision-makers make, and it usually comes from skipping the classification step.
- Structural trends reflect permanent shifts in how a market works, like the move to subscription pricing across software. These persist across economic cycles and justify long-term investment.
- Cyclical trends track the broader economy, expansion and contraction tied to interest rates, employment, or credit conditions. They repeat, but not on a fixed calendar.
- Seasonal trends repeat on a predictable schedule, holiday retail spikes, back-to-school demand, tax-season software usage.
- Emergent or disruptor trends are new behaviors or technologies just starting to gain traction, often with unclear durability early on.
Persistence and breadth are your best clues. A trend that shows up across multiple regions, channels, and customer segments is more likely structural than one confined to a single geography or platform. Separating seasonal spikes from durable shifts requires seasonality decomposition, a technique covered in more detail below, because a November sales jump can look identical to genuine structural growth if you only look at raw numbers.
How Do You Perform Market Trend Analysis Step by Step?
Here’s a six-step process that holds up whether you’re tracking a single product category or monitoring an entire industry.
- Define the decision question and scope. Write down the specific business decision this analysis needs to inform, not “understand the market” but “should we enter the mid-market segment in Q3.” Vague questions produce vague, unusable trend reports.
- Assemble a source mix and set a baseline window. Pull at least two independent data types, transaction data plus search demand, or platform analytics plus pricing data, and normalize them to a common time scale before comparing.
- Measure momentum. Calculate velocity (how fast is it moving) and acceleration (is that speed increasing or decreasing) across rolling windows, not just a single before-and-after comparison.
- Segment and add context. Break the signal down by who, where, and which channel. A trend that’s real in one region but flat everywhere else tells a very different story than one showing up broadly.
- Validate with cross-source checks and human review. A single data source moving in one direction is a hypothesis, not a conclusion. Evidence that accumulates across multiple independent sources over time is what separates a real trend from noise.
- Translate to action and set a cadence. Decide whether the validated signal warrants a pilot, a full investment, continued monitoring, or deprioritization, and set a review date to check whether the trend held.
Pro Tip: Run steps 1 through 5 on a tight, two-week cycle for any market you’re actively deciding on. Waiting for a “complete” quarterly analysis often means you’re validating a trend that’s already three months old.
Which Analytical Methods Actually Prove a Trend Is Real?
A handful of methods do most of the heavy lifting once your data is assembled. Rolling averages smooth out day-to-day noise so you can see the underlying line. Year-over-year deltas control for seasonality by comparing the same period across different years. A regression slope quantifies direction and magnitude in a single number, useful for comparing the strength of multiple trends side by side.
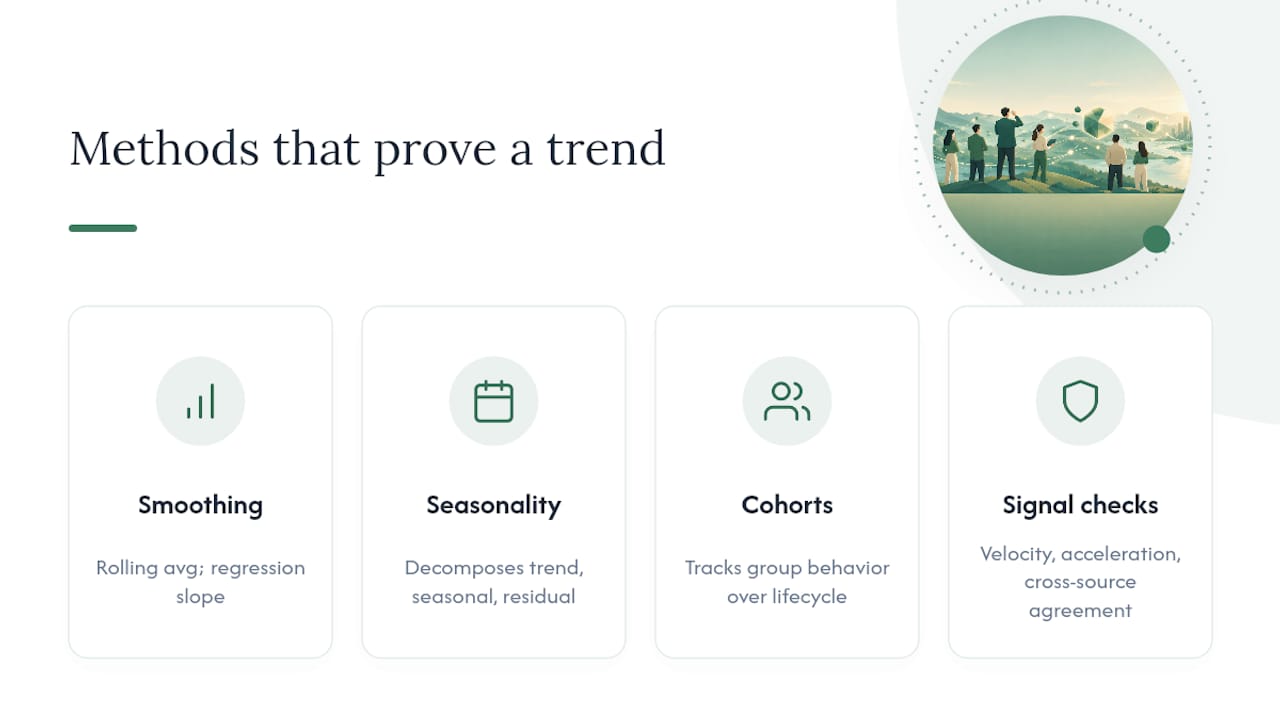
Seasonality decomposition matters more than most analysts give it credit for. It splits a time series into trend, seasonal, and residual (noise) components, which is the only reliable way to tell whether a spike is the calendar repeating itself or something genuinely new. Cohort analysis adds another layer, tracking how a specific group of customers behaves over its lifecycle rather than lumping everyone together, which is essential for spotting adoption or retention trends that aggregate numbers hide.
For signal strength, track velocity (rate of change), acceleration (whether that rate is climbing), and cross-source agreement (do independent data sets point the same direction). Pattern-matching across time-series data often reveals root causes that simple averages miss entirely. Before trusting any of this, run basic validation checks: confirm timestamps align, scan for duplicate records, and watch for schema drift when a data provider quietly changes a field definition mid-stream.
What Tools Belong in a Market Trend Analysis Toolkit?
Different questions call for different tooling, and trying to force one platform to do everything is a common source of frustration. Consumer panels answer “who’s buying and why.” Web and social listening tools catch early qualitative shifts. Search demand platforms quantify interest before it becomes revenue. Time-series analytics tools handle the statistical heavy lifting once data is assembled. Data ops platforms keep the whole pipeline clean and current.
- Use a quick scan (a single tool, a narrow date range, a fast turnaround) when you’re testing a hypothesis before committing budget.
- Move to a production pipeline (multiple integrated sources, scheduled refreshes, automated validation) once a trend is guiding a real investment decision.
- Evaluate any tool against four criteria: data freshness, schema stability over time, breadth of coverage, and how much ongoing maintenance it demands from your team.
A quick scan that takes an afternoon is often enough to decide whether a full production build is worth the investment. Skipping straight to heavy infrastructure for a question you haven’t validated yet wastes both time and budget.
How Do You Turn a Validated Trend Into a Business Decision?
A validated trend is worthless if it sits in a slide deck. The move from insight to action works best with a simple decision template attached to each finding: invest, pilot, monitor, or deprioritize, each with its own KPI attached from day one.
An “invest” decision might carry a KPI like market share gain within two quarters. A “pilot” decision might track conversion lift in a single test region before wider rollout. “Deprioritize” isn’t a dead end; it’s a note to revisit the signal in a set number of months if conditions change.
Set your monitoring cadence based on how fast the underlying market moves. Consumer social trends might need weekly checks. B2B category shifts might only need a monthly pass. Comparing patent filings, funding trends, and long-run sales data helps assess how mature or durable a signal actually is before locking in a bigger commitment. Whatever cadence you pick, write it down. An unscheduled review is a review that doesn’t happen.
What Do Real Trend Analysis Cases Look Like?
Three anonymized scenarios show how this plays out in practice.
- A consumer goods team saw a spike in a specific flavor category and nearly greenlit a new product line, until seasonality decomposition revealed the spike matched the exact same week in the prior two years. It was a holiday pattern, not new demand.
- A B2B software company tracked rising search demand for a competitor’s category name across six months, cross-checked it against usage data from their own free tier, and confirmed a genuine structural shift toward that use case. They shipped a feature in response and captured early adopters before competitors reacted.
- A retailer noticed a regional sales uptick that looked promising until segmentation showed it was concentrated in a single store running an unrelated promotion. Broader rollout was paused.
The common thread: validating signals across independent sources before committing resources caught two false positives and confirmed one real opportunity.
Who’s Behind This Kind of Analysis, and Does the Tooling Hold Up?
Reliable trend work depends on treating the whole pipeline, sourcing, normalization, validation, review, as a data product rather than a one-off report. That framing catches false positives before they turn into bad decisions, and it’s the same discipline behind Prowl, which gives any agent or workflow access to 448 market-intelligence tools through a single connector.
Prowl’s unified MCP layer pulls SEO, ad performance, and competitor analysis into one workflow instead of requiring separate integrations for each. For a team running the six-step process above on a weekly cadence, that consolidation is the difference between a trend scan that takes an afternoon and one that takes a week of tool-switching.
What Actually Breaks Trend Programs Inside Companies
The biggest trap isn’t bad analysis. It’s building a one-time trend report instead of a repeatable process, then wondering why insight goes stale within a quarter. Second most common: skipping validation because a single striking data point feels conclusive enough to act on.
A few practical shortcuts help busy teams. Automate the data pull, keep the human judgment on interpretation, and set a fixed review cadence so trend work doesn’t compete for attention with whatever fire is burning that week. On governance, keep it short: confirm your sources, document any schema changes, log who reviewed each conclusion, and set a expiration date on every “monitor” decision so it doesn’t sit forgotten. Complexity kills adoption faster than bad data does.
— Sergey
How Prowl Fits Into Your Trend Analysis Workflow
If you’ve made it this far, you already know the hard part isn’t running one trend scan. It’s doing this every week without burning a full day on tool-switching between search data, ad platforms, and competitor trackers. Prowl replaces that separate-tool shuffle with one connector: your agent pulls SEO, ad performance, pricing, and competitor signals from 448 intelligence tools through a single MCP integration, then synthesizes them into a report in minutes instead of hours.

For teams just testing the waters, $10 in credits covers a first scoped trend scan without committing to a subscription. Teams running this on a recurring cadence tend to land on the Exploit plan at $60 per month, which covers ongoing monitoring without repurchasing credits every cycle. If you’re already running agents through Claude or Cursor, check the Claude MCP Server or Cursor MCP Server setup pages, then visit Getting Started to connect your first workflow today.
Sources
The strongest trend work blends hard numbers with human context. Neither alone tells the full story.
On the quantitative side, prioritize sales and transaction data (the most direct signal of actual behavior), search demand data, platform analytics, pricing and assortment changes among competitors, and trade or import statistics for physical goods categories. On the qualitative side, customer panels, direct interviews, social listening, and cultural content signals (what’s showing up in creator content, forums, and niche communities before it hits mainstream metrics) fill in the “why” behind the numbers.
- Trend analysis — Investopedia
- Trend analysis fundamentals — Snowflake
- A product manager’s guide to market trend analysis — Pragmatic Institute
Each source carries a trade-off. Fast-moving signals like search demand are fresh but shallow. Panels and interviews go deep but take weeks to assemble. Broader coverage tends to cost more and introduce governance risk, especially with third-party data where licensing terms or sampling methods aren’t fully transparent. Weak ingestion and undocumented transforms are where most trend pipelines quietly break down, long before the analysis stage.
FAQ
What Are the Six Steps in Trend Analysis?
The core sequence is: define the decision question, assemble and normalize your data sources, measure momentum, segment and contextualize the signal, validate across sources with human review, then translate the finding into a pilot, investment, monitoring, or deprioritization decision. Each step feeds the next, so skipping validation is the step most likely to produce a false positive.
What Is Market Trend Analysis?
Market trend analysis is the process of examining market data over time to identify directional movement, up, down, or sideways, and how fast that movement is happening. It draws on tools like moving averages, momentum indicators, and trendlines to turn raw data into a readable signal decision-makers can act on.
What Are Current Market Trends Right Now?
Current trends vary sharply by category and region, which is exactly why a generic answer is unreliable, run a scoped scan against your specific market rather than relying on a broad claim. Structural shifts, like the ongoing move toward subscription and usage-based pricing across software categories, tend to hold steadier value than short-lived cyclical or seasonal spikes.
How Do You Identify a Market Trend?
You confirm a market trend by tracking the same metric across multiple independent sources over a consistent time window and checking for persistence, breadth across segments, and increasing velocity. A single data point moving in one direction is a hypothesis; a trend is confirmed once multiple sources agree over time.
How Much Does Prowl Cost for Ongoing Trend Monitoring?
Prowl offers pay-as-you-go credits starting at $10 for one-off scans, plus monthly plans starting at $60 per month for the Exploit plan for teams running trend analysis on a recurring cadence. Higher-volume plans, Blackops and Syndicate, scale up from there for larger monitoring workloads.