
Market share analysis measures the percentage of a market’s total sales, units, or customers that a single company captures over a defined period. The formula is simple: divide company sales by total market sales and multiply by 100. What matters more is what you do with the number. Done right, it tells managers whether to invest in growth, defend a position, or pull back and improve margins instead.
TL;DR:
- Tracking revenue, units, or user share depends on market characteristics and can drastically change the perceived competitive position if chosen incorrectly.
- Defining the correct market scope is crucial, as even small discrepancies or scope errors can lead to misleading share calculations.
- Using multiple data sources and comparing build-up versus top-down methods help validate your market share estimates and identify potential inaccuracies.
- Continuous monitoring with automated tools and rolling data updates is essential in fast-moving markets, especially for software and B2B industries.
- Present share data alongside market growth rates to accurately interpret whether a stable share indicates success or warning signs of losing ground.
Table of Contents
- Why Market Share Analysis Matters for Business Strategy
- What Types of Market Share Should You Track?
- How Do You Calculate Market Share Step by Step?
- Where Should You Get Reliable Market Share Data?
- What Mistakes Undermine Market Share Analysis?
- What Tools and Methods Work Best for Ongoing Tracking?
- A Manager’s phased plan for ongoing Market Share Tracking
- Automate Your Recurring Market Share Reporting With Prowl
- Where to Go Deeper on Market Share Methodology
- Sources
Why Market Share Analysis Matters for Business Strategy
Market share is not a vanity metric. Research tied to the PIMS project, summarized by Harvard Business Review, found that share is frequently and positively linked to profitability across a wide range of industries, though the strength of that link depends heavily on industry structure and how the market is defined. A company gaining share in a growing category is a different story than one gaining share because competitors are exiting.
Raw growth numbers can mislead. A company growing sales 10% a year sounds healthy until you learn the category grew 20%. That business is losing ground even as its revenue climbs, and only a market share analysis would catch it.
Managers lean on share data for a few recurring, high-stakes decisions:
- Setting pricing strategy when a challenger brand needs room to undercut a leader without triggering a margin war
- Framing the growth story for investors ahead of a funding round or earnings call
- Sizing up acquisition targets during M&A due diligence
- Deciding which markets or segments deserve the next marketing dollar
Pro Tip: When you present share data to investors or a board, always pair the percentage with the market’s growth rate. A stable 15% share in a shrinking market is a warning sign, not a comfort.
What Types of Market Share Should You Track?
Not every market share metric measures the same thing, and picking the wrong one can lead to the wrong conclusion. The Department of Justice’s merger guidelines note that revenue, units, capacity, and user counts can all be informative, and the right choice depends on the market you’re studying.
- Revenue share: total dollars captured, best for markets with meaningful price variation.
- Unit or volume share: physical goods sold, useful when comparing companies with different pricing tiers.
- Value share: revenue weighted by category, common in consumer packaged goods analysis.
- Customer share: percentage of the addressable customer base signed on. This is critical in B2B contract-driven markets.
- Usage or user share: active users or engagement, the standard for freemium and platform businesses.
A subscription software company with a low-price, high-volume plan can lead on unit share while trailing on revenue share. A SaaS revenue model evaluation makes this exact point: the metric you choose can flip the entire narrative about who is winning.
How Do You Calculate Market Share Step by Step?
A reliable market share analysis follows the same four moves every time, whether you’re studying a $50 million regional niche or a global industry. The DOJ’s framework breaks it into defining scope, gathering data, computing the share, and interpreting the trend, typically across a 3 to 5 year window to smooth out cyclical noise.
- Define the scope. Decide which products, geographies, and substitute goods count as “the market.” A narrow definition inflates share; a bloated one dilutes it. This single decision causes more analytical errors than any other step.
- Gather market and firm data. Pull from industry reports, government statistics, public company filings, and primary surveys. For private competitors, you’ll need to estimate.
- Choose your metric and compute the series. Pick revenue, unit, or user share based on what the market actually rewards, then calculate it consistently across every period.
- Adjust for seasonality and outliers. A single strong quarter driven by a one-time contract will distort your trend line if you don’t smooth it out.
- Choose build-up versus top-down. When solid market totals exist, divide your revenue by the published total. When they don’t, build the market from the bottom up using segment-level penetration rates, an approach HBS faculty research ties directly to sales forecasting.
- Translate movement into action. A two-point share gain in a flat market justifies more sales headcount. A two-point loss in a growing market demands a pricing or product review before the next budget cycle.
Pro Tip: Run the calculation both ways when you can, build-up and top-down, and treat any gap between the two results as your margin of error rather than picking whichever number looks better.
Where Should You Get Reliable Market Share Data?
The quality of a market share analysis is capped by the quality of its inputs. Four sources do most of the heavy lifting, and each has a different reliability profile.
- Government statistics (census data, trade bureaus, regulatory filings) offer the most objective totals but often lag by months or a full year.
- Industry research reports, including methodologies from firms like Gartner, allocate revenue across named providers and are the fastest route to a credible market total.
- Company filings (10-Ks, investor decks, earnings calls) give you hard revenue figures for public competitors, though private rivals require estimation.
- Primary surveys and interviews fill the gaps when public data doesn’t exist, an approach the Freedonia Group recommends for markets dominated by private companies.
Refresh your numbers on a rolling or quarterly cadence rather than an annual snapshot, especially in fast-moving B2B software markets where competitive positions shift within a single quarter. Whatever assumptions you use for private-company estimates, document them and apply the same logic every period. Triangulate at least two sources before publishing a figure internally, and run a sensitivity check to see how much your conclusion changes if your estimate is off by 10%.
What Mistakes Undermine Market Share Analysis?
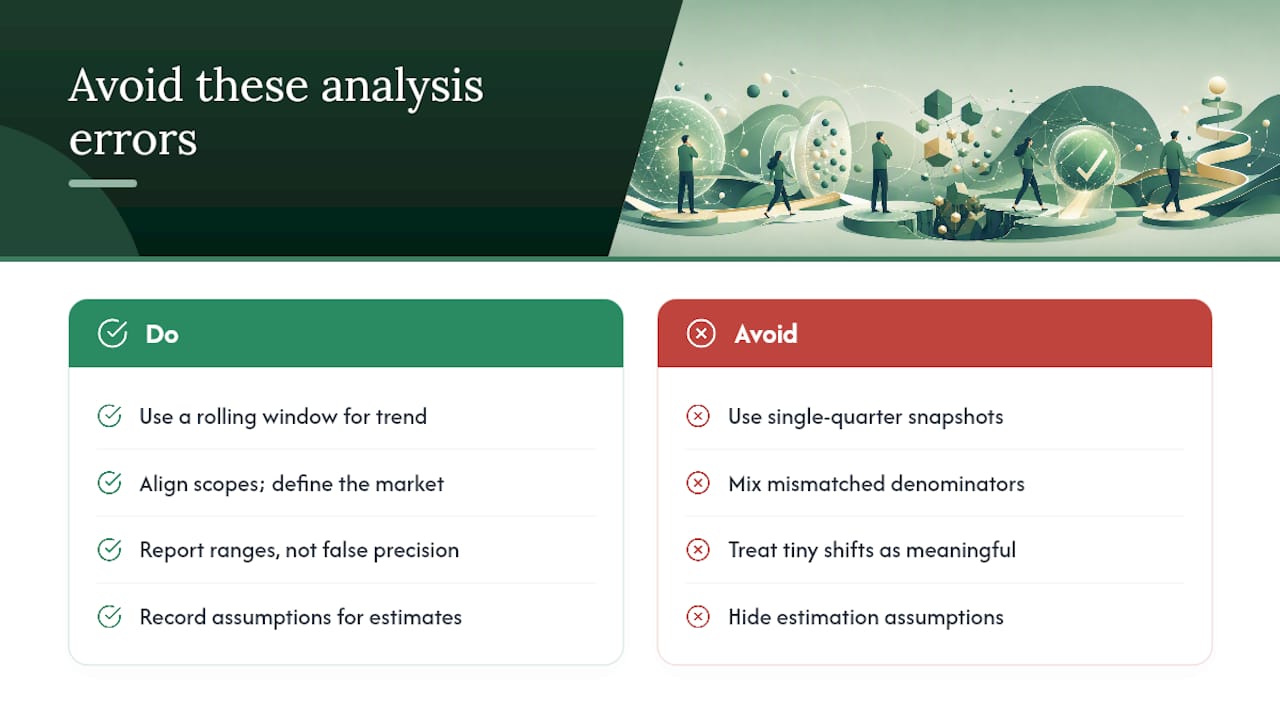
The single most common error is the static-snapshot trap: pulling one quarter’s numbers and treating them as the trend. A rolling window catches seasonal swings that a point-in-time snapshot masks entirely.
The second is denominator mismatch. If your competitor’s reported revenue includes an adjacent product line that yours doesn’t, you’re comparing two different markets and calling it one. The DOJ’s guidance on market definition exists precisely because scope errors are the leading cause of misleading share results.
The third is treating small movements as meaningful. A 0.3 percentage point shift quarter over quarter is often just noise, particularly when your estimates already carry uncertainty. Present a range instead of a false-precision point estimate, and write down every assumption behind your private-company estimates so the next analyst can audit your logic instead of guessing at it.
What Tools and Methods Work Best for Ongoing Tracking?
Spreadsheets still handle one-off share calculations fine. Once you need the same report every month across multiple products or regions, manual pulls become the bottleneck, not the analysis itself.
Three tiers of tooling exist for this work:
- Spreadsheets and BI dashboards work for small, stable markets with few data sources to reconcile.
- Market-research subscriptions, following methodologies like Gartner’s revenue-allocation approach, give you vetted totals but on someone else’s update schedule.
- Connector-based platforms, sometimes called MCPs (market intelligence connectors), pull from multiple data sources into one pipeline and regenerate the same report structure every cycle without manual rebuilding.
Connector-based platforms pull from multiple data sources into one pipeline and regenerate the same report structure every cycle without manual rebuilding. Manual primary research still matters when you need qualitative context, like buyer intent or unpublished competitor pricing, that automated pipelines simply can’t reach.
Pro Tip: Automate the recurring, data-heavy pulls and save your analyst hours for the interpretation. The moment a report becomes a monthly copy-paste exercise is the moment it should be automated.
A Manager’s phased plan for ongoing Market Share Tracking
Here’s where most teams waste time: they chase a perfect market definition before running a single calculation. Don’t. In the first 30 days, validate your scope, confirm your denominator matches your competitors’ actual reported categories, and stand up a rolling dashboard, even a rough one.

By day 60, improve your inputs. Layer in a second data source, break the market into segments that matter to your pricing strategy, and stress-test your estimates with a sensitivity check.
After initial tracking, stop treating share as a report and start treating it as an input. Feed share trends into your forecasting model to inform budget cycles and planning.
— Sergey
Automate Your Recurring Market Share Reporting With Prowl
Some platforms replace the monthly scramble of pulling data from different tools with one connector that feeds your AI agent everything it needs to rebuild a market share report on schedule. If your team is running the same competitive benchmarking or share-tracking analysis every quarter and rebuilding it from scratch each time, that’s exactly the repeatable workflow such tools are built to handle.

Such platforms fit teams at marketing agencies, analysts inside growth teams, and product managers who need a real-time snapshot of competitor positioning without setting up a dozen individual subscriptions. They often output reports as interactive dashboards, PDFs, or slide decks, whatever format stakeholders actually read. Explore the use cases for market intelligence workflows or head straight to getting started with Prowl to connect it to your existing agent and run your first automated share report this week.
Where to Go Deeper on Market Share Methodology
For the calculation itself, the DOJ’s merger guidelines lay out the government’s own methodology for defining scope and computing shares. The HBR summary of PIMS research remains the clearest case for why share deserves a seat at the strategy table. Gartner’s methodology shows how professional analysts allocate revenue across a crowded provider field, and Investopedia’s breakdown is the fastest refresher on the formula itself.
Sources
- Antitrust Division | 4.4. Calculating Market Shares and Concentration | United States Department of Justice
- Market Share—a Key to Profitability - Harvard Business Review
- Market Share Research Methodology - Gartner