
Funnel analysis automation continuously detects where buyers stall and triggers prioritized actions so teams fix the largest leaks faster. It works through three connected components: instrumented data that captures every stage transition, a decisioning layer that scores and prioritizes what to fix, and automated execution that routes leads or launches tests without waiting for a weekly report.
TL;DR:
- Funnel analysis automation responds to specific drops at each funnel stage by comparing current data to your own historical baseline rather than industry averages, improving detection accuracy.
- Properly defining entry and exit criteria for each funnel stage ensures automated signals are reliable and tailored to your sales and user behavior models.
- Building a clean, consistent event data pipeline and continuously auditing event taxonomy are crucial for trustworthy automation and accurate measurement.
- Combining fit scoring with behavioral signals, enhanced by explainable AI guardrails, optimizes lead routing and prioritization for better conversion outcomes.
- Most challenges stem from establishing precise definitions and reliable data collection rather than scoring models or dashboards alone.
Table of Contents
- What Funnel Analysis Automation Actually Covers
- Which Metrics Matter at Each Funnel Stage?
- Building the Data Pipeline Behind Automated Tracking
- How Automated Scoring and Routing Should Work
- Turning Funnel Data Into Dashboards That Drive Decisions
- The Test, Measure, Ship Loop for Funnel Fixes
- Prowl in Practice: An Example Diagnostic Workflow
- Your 30/60/90-Day Rollout Plan
- Adapting Funnel Automation Across Business Models
- Why Most Funnel Advice Undersells the Hard Part
- Get Funnel Diagnostics Without Building the Stack Yourself
- Sources
What Funnel Analysis Automation Actually Covers
A funnel analysis is a stage-by-stage map of how prospects move from first contact to paying customer, and where they drop off along the way. An automated funnel takes that same map and wires it to live event data instead of a monthly export. Automated funnel analysis, then, is the practice of continuously scoring those stage transitions and triggering a response, whether that’s a Slack alert, a lead routing rule, or a retargeting campaign, without a human pulling the report first.
The distinction matters because most funnel audits happen too late to help. A quarterly review tells you that trial-to-paid conversion dropped last month. Automation tells you it dropped this week, on a specific onboarding step, for a specific segment, and it fires the fix before the cohort is gone. That shift from periodic audit to operating signal is the entire value proposition.
The business case is straightforward. Faster leak detection shortens the cycle between “something broke” and “we fixed it,” which compounds into lower customer acquisition cost over a quarter. It also forces marketing and sales to work from the same numbers, since funnel optimization functions as a systemic loop requiring shared data and coordinated workflows across departments rather than a report one team owns and the other ignores.
Not every funnel is a straight line, and pretending otherwise breaks automation before it starts. Three common shapes:
- Linear funnels move prospects through a fixed sequence (ad → landing page → demo → close), common in high-touch B2B sales.
- Looped funnels let users re-enter earlier stages (a churned trial user comes back six months later), common in product-led growth.
- Self-serve funnels skip human touchpoints almost entirely, with the product itself doing the qualifying.
Each shape needs its own entry and exit rules. Trying to force a self-serve product funnel into the same stage logic as an enterprise sales funnel is the fastest way to generate automation that fires on garbage signals.
Which Metrics Matter at Each Funnel Stage?
Automation is only as good as the metrics feeding it, and vague stage boundaries produce noisy alerts. Before instrumenting anything, write a one-sentence entry and exit definition for every stage — something like “MQL = contact with firmographic fit who visited the pricing page twice or completed trial setup.” Encode that sentence directly into your scoring logic so events map deterministically to a stage, rather than leaving it to interpretation.
With definitions locked, the metrics catalog looks like this:
- TOFU (top of funnel): reach, click-through rate, bounce rate, and engaged sessions, which tell you whether the right people are even showing up.
- MOFU (middle of funnel): content-assisted conversions and demo or trial starts, which show whether interest is converting into evaluation.
- BOFU (bottom of funnel): demo-to-trial rate, trial-to-paid rate, and win rate, the metrics that most directly predict revenue.
- Retention: activation depth (how much of the product a new customer actually uses) and churn, which reveal whether the funnel is filling a leaky bucket.
Behavioral intent signals matter as much as conversion counts. A prospect who revisits the pricing page three times in a week is behaving differently than one who visited once and vanished. Track pricing page revisits, repeat documentation views, depth of trial feature usage, and flags from session replay tools that catch friction points a conversion rate alone can’t show, like a user who rage-clicks a broken form field five times before leaving.
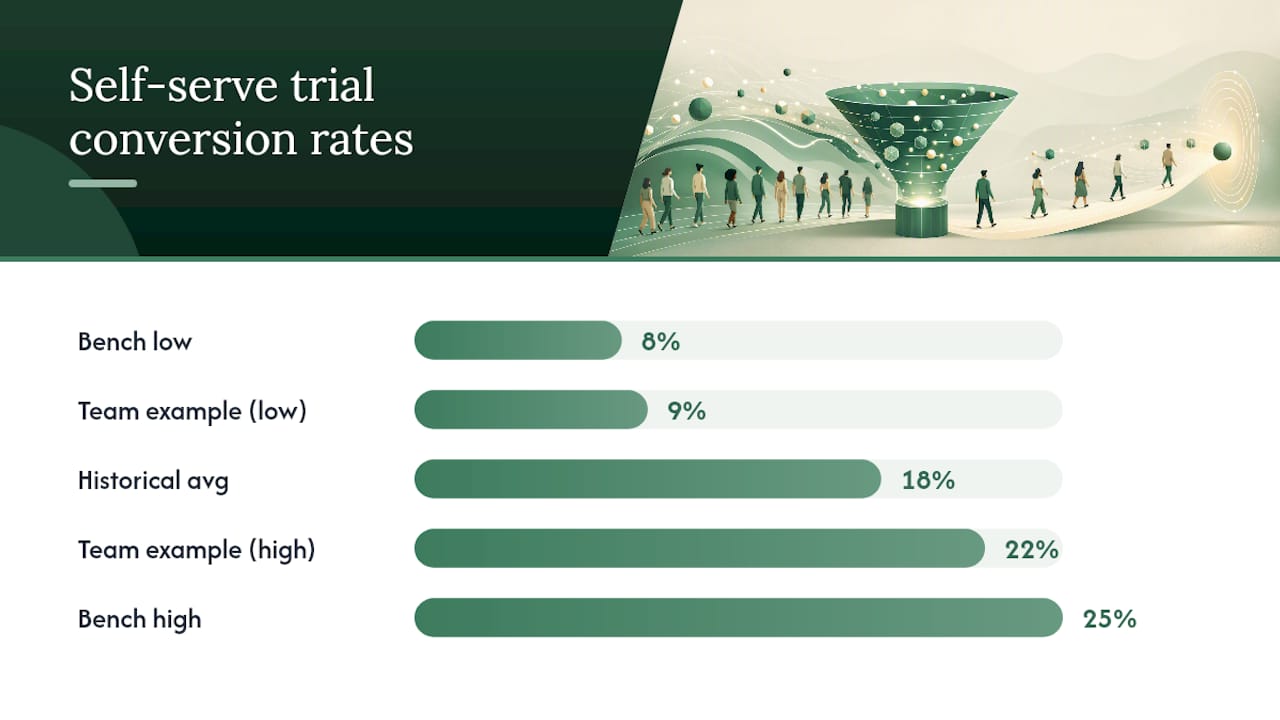
Self-serve trial conversion typically lands between 8% and 25%, according to HubSpot’s analysis of conversion funnel benchmarks. That range is wide enough that a team sitting at 9% and a team sitting at 22% could both call themselves “on benchmark,” which is exactly why automation needs to compare your funnel against its own historical baseline, not a single industry number. A sudden five-point drop from your own 18% average is a far more useful trigger than a static comparison to someone else’s midpoint.
Building the Data Pipeline Behind Automated Tracking
Every automated funnel analysis, no matter how sophisticated the scoring model on top of it, depends on getting clean, complete event data first. Get this wrong and every dashboard, score, and routing rule built on top of it inherits the error.
Start with a defined event taxonomy. Every stage needs a corresponding event name, a consistent schema, and an owner responsible for keeping it accurate. “Trial Started,” “Pricing Page Viewed,” and “Demo Requested” should fire the same way every time, from every source, with the same property names attached.
- Choose server-side or warehouse-native capture over client-side-only tracking. Browser-based analytics sample data, drop events behind ad blockers, and fragment across devices. Analysts handling mission-critical decisions prefer querying raw event data directly in a warehouse like Snowflake or BigQuery specifically because it avoids sampling and produces exact, auditable conversion numbers.
- Stitch identity across sessions and devices. A prospect who researches on mobile and converts on desktop needs to be recognized as the same person, or your MOFU numbers will look worse than they are.
- Enrich events with firmographic and cost data. Tying acquisition spend to specific funnel events is what lets you calculate blended CAC by channel instead of guessing.
- Tag every campaign consistently. UTM parameters that vary by team or campaign manager quietly poison attribution reporting for months before anyone notices.
Your instrumentation checklist, in the order most teams actually tackle it:
- UTM parameters standardized across every paid and owned channel
- Lifecycle events (lead created, MQL, SQL, opportunity, closed-won) firing from a single source of truth
- Trial and product signals (feature adoption, activation milestones) piped from the product database, not just marketing tools
- Session replay hooks on high-drop pages, particularly forms and pricing
- A documented event dictionary that new hires can read without asking three people what “Stage 3” means
A practical build sequence follows a predictable order: map the funnel stages, select integrated tools, implement lead capture with progressive profiling, set up scoring and nurture paths, then instrument the remaining signals for continuous optimization. Skipping straight to scoring before the data pipeline is solid just automates bad decisions faster.
Pro Tip: Audit your event taxonomy every quarter, not just when something breaks. Teams add new landing pages, forms, and product features constantly, and each one is a potential untracked gap that quietly corrupts your funnel math until a report looks obviously wrong.
Progressive profiling deserves a specific mention here. Instead of demanding job title, company size, and budget on a first form, collect richer lead data gradually across multiple touchpoints, which keeps early-funnel friction low while still feeding your scoring model the fields it needs by the time a lead reaches BOFU. If you need a lower-friction reference point for form design, shorter forms consistently reduce landing page abandonment, a pattern that holds well beyond the storage industry example it comes from.
How Automated Scoring and Routing Should Work
Turning raw signals into action requires a scoring model, and the models that hold up in production almost always combine two inputs rather than relying on one.
Fit scoring measures how closely a lead matches your ideal customer profile: company size, industry, tech stack, budget signals. Behavior scoring measures what the lead actually does: pages visited, emails opened, trial features touched, pricing page revisits. A lead with perfect firmographic fit but zero engagement is not the same priority as a mid-fit lead who just viewed your pricing page for the third time this week. Blending both into a single weighted score is what most mature revenue teams run on.
AI-assisted scoring adds real value on top of that blend, mainly by finding non-obvious behavioral patterns across thousands of leads that a static point system would miss, like a specific sequence of feature usage that predicts conversion better than any single event alone. But it needs guardrails, or it becomes a liability instead of an asset:
- Explainability first. If a sales rep can’t see why a lead scored an 85, they won’t trust the score, and they’ll route around it.
- Set an ambiguity threshold. Log every score input and the exact rule that produced a routing decision, and route anything in a middle band to human review instead of auto-routing it.
- Cap automated outreach volume. A model that’s confidently wrong at scale does more damage than one that’s cautiously right less often.
- Review model drift monthly. Buyer behavior shifts with the market; a scoring model tuned six months ago may be actively misprioritizing leads today.
Common automated actions once a score crosses a threshold include routing a lead to the right rep, triggering a nurture email sequence, launching a retargeting segment, or firing an in-app prompt for product-led signals. None of that works without clear operational rules underneath it: who owns which stage, what SLA applies to a routed lead (same-day follow-up on a hot score, three-day on a warm one), and an audit trail showing exactly why the system did what it did.
Pro Tip: Build the human review queue before you build the automation. Teams that skip it end up building it anyway, six weeks later, after an AI-scored lead gets auto-emailed something embarrassing.
Turning Funnel Data Into Dashboards That Drive Decisions
A dashboard that just shows conversion rate by stage is a report, not a diagnostic tool. The dashboards that actually change behavior show where time and volume are being lost, not just where the percentage dropped.
Core elements worth building first:
- Stage-to-stage conversion rate, segmented by channel and campaign, not blended into one number.
- Time-in-stage, which often reveals a stalled deal before a dropped one does.
- Drop-off heatmaps on specific pages or steps, showing exactly where in a multi-step form or onboarding flow people abandon.
- Cohort velocity, tracking whether this month’s signups are moving through the funnel faster or slower than last month’s.
Attribution modeling choice depends on the decision you’re trying to make. Multi-touch attribution models are worth the complexity when you’re justifying budget allocation across five or six channels feeding a long B2B sales cycle. For most operational, day-to-day questions, though, a simpler event-based model in a platform like GA4 answers “which specific step is leaking users” faster and with less argument about methodology.
The feedback loop matters as much as the dashboard itself. Feeding enriched conversion events back to ad platforms gives their machine learning better signal about what a “good” conversion actually looks like downstream, not just a form fill. A platform optimizing toward trial starts will find you more trial starts. A platform optimizing toward trials that convert to paid within 30 days will find you better trials.
The Test, Measure, Ship Loop for Funnel Fixes
Automation surfaces the leak. It doesn’t fix it on its own. That still takes a disciplined experiment loop, and the teams that run it well follow roughly the same five steps every time:
- Pick the bottleneck with the biggest combined impact and volume, not the one that’s easiest to fix or loudest in a meeting.
- Write a specific hypothesis, something falsifiable like “reducing the signup form from seven fields to four will lift completion by at least 15%.”
- Run the test with a clear control group and a defined sample size, not a vague “let’s see how it goes.”
- Measure three things together, not one: conversion rate, funnel velocity, and CAC impact, since a test can win on conversion and still lose on cost.
- Ship the winner and document why, so the next person doesn’t rerun a test you already answered eight months ago.
High-leverage tests worth running early include shortening multi-step forms to reduce qualification friction, clarifying pricing page copy and layout, redesigning trial onboarding to hit an activation milestone faster, and running messaging alignment tests between what ads promise and what the landing page actually says.
Prioritize experiments by multiplying relative conversion lift potential against affected traffic volume and revenue per conversion, which keeps the backlog ranked by actual business impact instead of by whoever pitched loudest in the planning meeting. A five-point lift on a page that sees 50 visitors a month matters less than a two-point lift on a page that sees 5,000.
Prowl in Practice: An Example Diagnostic Workflow
A platform that connects any AI agent to hundreds of marketing intelligence tools through a single MCP integration, which matters here because building the reporting layer described above by hand, one tool at a time, is exactly the setup cost that keeps funnel diagnostics stuck in quarterly reviews instead of running continuously.
A practical workflow looks like this: connect your existing data sources, run an agent query against Prowl’s tool set to pull competitor benchmarks and intent signal patterns alongside your own funnel data, generate a diagnostic report that flags the highest-leverage stage, then export the prioritized action list to your CRM or automation platform for routing.
What that replaces in practice:
- Manually pulling data from five separate tools before you can even start comparing stages
- Waiting on an analyst’s availability to synthesize a competitive or funnel benchmark report
- Rebuilding the same diagnostic report format every month by hand
For teams running this monthly instead of quarterly, the practical outcome is a diagnostic report generated in the time it used to take to schedule the meeting about the diagnostic report. The use case library shows several of these workflows applied to real reporting scenarios, from competitive benchmarking to ad performance synthesis.
Your 30/60/90-Day Rollout Plan
In the first 30 days, define stage entry/exit rules and fix the top three instrumentation gaps. By day 60, stand up warehouse-native tracking and a basic scoring model with a human review queue. By day 90, run your first two prioritized experiments and measure conversion, velocity, and CAC together.
Ownership should sit with a small cross-functional group: analytics owns the pipeline, marketing operations owns scoring rules, and sales owns the SLA on routed leads. Early ROI shows up as faster leak detection and shorter time-to-fix, not a single dramatic revenue jump. That’s your signal you’re ready to scale the loop, not a reason to think it isn’t working yet.
Adapting Funnel Automation Across Business Models
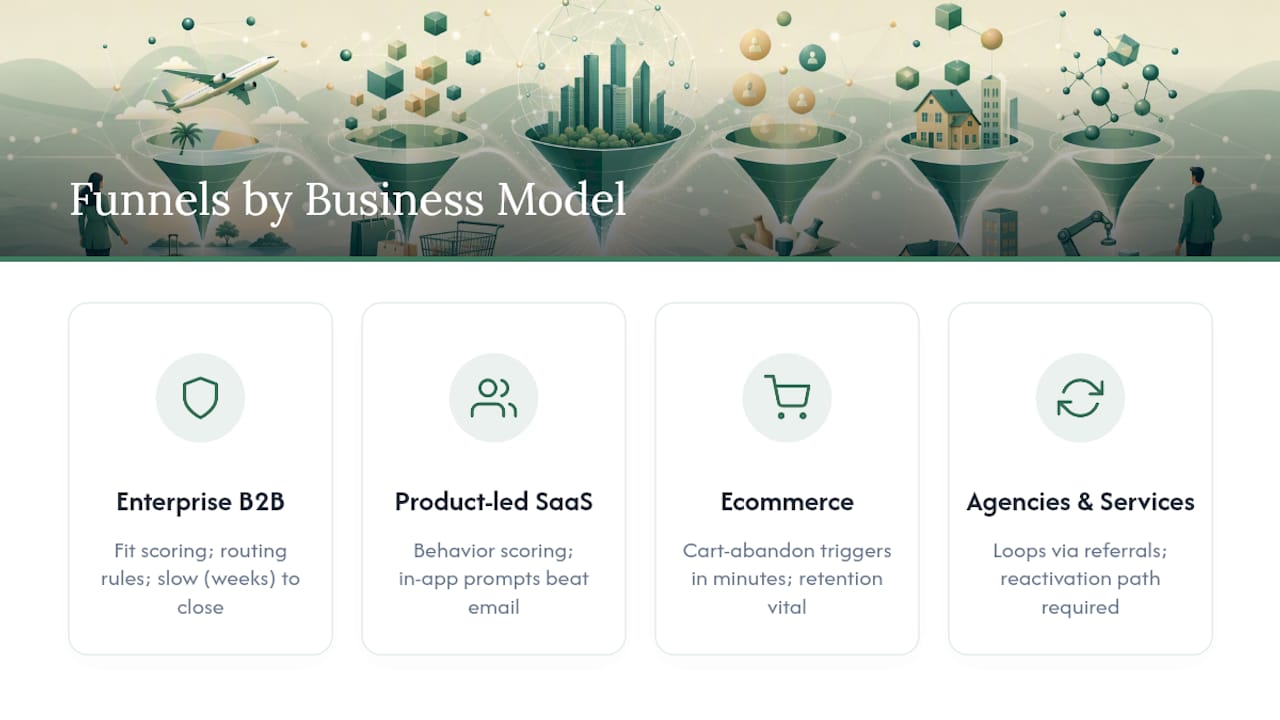
A five-stage enterprise sales funnel and a self-serve SaaS signup flow need almost entirely different automation logic, even though both are technically “funnels.”
For high-touch B2B, automation should weight fit scoring heavily, since deal sizes are large enough that a mismatched lead wastes real rep time. Routing rules matter more than in-app prompts, because a human closes the deal.
For product-led SaaS, behavior scoring dominates. In-app usage signals, like whether a trial user actually invited a teammate or connected an integration, predict conversion far better than firmographic fit. Automated in-app prompts often outperform email sequences here.
For ecommerce, the funnel compresses into days or hours instead of weeks, so automation needs to fire faster: cart abandonment triggers within minutes, not the next business day. Retention metrics matter as much as initial conversion, since repeat purchase rate often drives more lifetime value than the first sale.
For agencies and services businesses, the funnel often loops back through referral and repeat-engagement stages that a linear model misses entirely, so exit rules need a “reactivation” path built in from day one rather than treating churned contacts as dead leads.
The common thread: don’t import someone else’s funnel template. Write your own stage definitions first, then build the automation around them, using the metrics catalog above as a starting menu rather than a fixed prescription.
Why Most Funnel Advice Undersells the Hard Part
The conventional advice on this topic spends most of its energy on scoring models and dashboards, and almost none on the unglamorous work underneath them: writing a precise, one-sentence definition for what actually counts as an MQL. That’s backwards. A brilliant AI-assisted scoring model built on top of a vague stage definition just produces confident, wrong answers faster than a human would have.
The teams getting real value from automation aren’t the ones with the most sophisticated model. They’re the ones who spent a week arguing about what “engaged” actually means before writing a single line of scoring logic. That argument is boring, and it’s also the entire foundation everything else stands on.
If you take one thing from this guide, prioritize the instrumentation checklist over the scoring model. A warehouse full of clean, well-defined event data with a mediocre scoring rule on top will outperform a brilliant model built on fragmented, sampled data every time. Fix the foundation first. The clever part comes easier once the data underneath it can actually be trusted.
— Sergey
Get Funnel Diagnostics Without Building the Stack Yourself
Prowl gets you a funnel diagnostic report in the time it takes to run one query, not the weeks it takes to wire together five separate analytics tools by hand. Instead of manually pulling data from your CRM, ad platforms, and product analytics before you can even see where the leak is, one MCP connection gives an AI agent direct access to many intelligence tools for pulling competitive benchmarks, intent signals, and funnel diagnostics in a single pass.

That fits naturally with everything in this guide: define your stage rules, instrument your events, then let Prowl handle the heavy lifting of synthesizing that data into a report you can act on the same day instead of the same quarter. If your team is still stuck reviewing funnel performance monthly instead of continuously, get started with Prowl and connect your first data source to see what a same-day diagnostic actually looks like.
Sources
- Monday
- How conversion funnels create a better customer journey (HubSpot)
- Marketing funnel automation: From awareness to retention (Braze)