
Competitive pricing analysis is the structured process of comparing your prices against rivals’ prices, then converting that comparison into a specific pricing decision. Start small: pick 10 to 20 high-impact SKUs or plans, pull current competitor prices, and normalize them into the same unit before you analyze anything. Anchor your interpretation with three proven tools: Prowl for fast data collection, Van Westendorp for price sensitivity, and Gabor-Granger for demand at specific price points.
TL;DR:
- Focus on a small, high-impact set of SKUs and normalize prices into a comparable unit before analysis to avoid breakdowns in comparison.
- Use tools like Van Westendorp and Gabor-Granger to gather demand insights from 30 to 50 respondents per segment, aligning willingness-to-pay with pricing strategy.
- Combine cost-plus, competitive parity, and value-based pricing methodologies to determine a safe price floor, market position, and maximum acceptable price.
- Regularly refresh data at least quarterly, with more frequent updates for fast-moving categories, and track key competitor price changes through automated alerts.
- Automate data collection and normalization with tools like Prowl to save analyst hours, enabling focus on strategic recommendations and simulation validation.
Table of Contents
- What Is Competitive Pricing Analysis, and When Should You Run It?
- What Business Outcomes Does Competitive Pricing Analysis Support?
- What Challenges and Data Limits Should You Expect?
- How Do You Run a Competitive Pricing Analysis Step by Step?
- Which Pricing Methodology Should Anchor Your Recommendation?
- How Often Should You Refresh and Who Signs Off?
- How Does Prowl Operationalize Competitive Pricing Analysis?
- How Do Customer Demographics Shape Your Pricing Recommendation?
- How Do You Track Competitor Price Changes in Real Time?
- What Do Successful Competitive Pricing Analyses Look Like in Practice?
- What Do Teams Get Wrong About Competitive Pricing Analysis?
- Let Prowl Handle the Data Pull So You Can Focus on the Recommendation
- Sources
What Is Competitive Pricing Analysis, and When Should You Run It?
Competitive pricing analysis explains why competitors price the way they do and turns that understanding into a rule for your own pricing. Price monitoring, by contrast, just logs what competitors currently charge. You need monitoring running all the time. You need full analysis only at specific decision points.
Run a full analysis when:
- You’re launching a new product or plan tier and need a defensible entry price
- Margins are tightening and leadership wants to know if the market will bear an increase
- You’re redesigning packaging or bundles and existing comparisons no longer hold
- A quarterly review of Key Value Items (KVIs) is due
Product managers usually own the scoping. Pricing analysts run the data work. Revenue operations and sales leadership sign off before anything ships, because a pricing change touches every open deal in the pipeline.
What Business Outcomes Does Competitive Pricing Analysis Support?
The return shows up in fewer emergency discounts and smarter shelf or plan positioning. When your team can point to a documented price index instead of a gut feeling, sales reps stop shaving margin just to close a deal.
Four outcomes matter most:
- Margin protection. A documented price index gives sales a defensible floor, cutting down on reflexive discounting.
- Better packaging decisions. Comparing bundles against rivals reveals which features buyers actually pay extra for.
- Early warning on competitor moves. Regular tracking catches a promotional cycle or price drop before it erodes your win rate.
- Sharper sales negotiation. Reps armed with a comparison matrix negotiate from data, not guesswork.
Willingness-to-pay research typically needs a modest number of respondents per segment to produce a usable demand curve, which means even a mid-sized company can run this work without a massive research budget.
Pro Tip: Track how often your sales team requests a discount exception before and after you roll out a pricing comparison matrix. That single metric often justifies the entire analysis budget on its own.
What Challenges and Data Limits Should You Expect?
Enterprise and B2B pricing is rarely what’s posted publicly. Negotiated discounts, custom bundles, and hidden enterprise tiers mean the listed price and the transacted price can differ by a wide margin. Primary research like mystery shopping, partner interviews, and sales win/loss records fills that gap when scraping alone comes up short.
Watch for these failure modes:
- Non-comparable pricing architectures (per-seat versus per-usage versus flat tiers) that require normalization before any comparison means anything
- Missing channels, like reseller or marketplace pricing that differs from the direct site
- Stale data from infrequent manual checks
- Regional pricing variance mistaken for a single global price point
Pro Tip: Don’t wait for complete data before drawing a conclusion. A partial data set covering your top five competitors is still more actionable than no data set at all, as long as you log the confidence level honestly.
How Do You Run a Competitive Pricing Analysis Step by Step?
This is the sequence experienced pricing teams follow, from scoping the question to shipping a recommendation with guardrails attached.
1. Define the goal and the competitive set
Write down the specific decision you’re trying to make. Is this launch pricing, a margin recovery review, or a packaging redesign? Then build your competitive set in tiers:
- Direct competitors: same product category, same buyer, similar positioning
- Indirect competitors: adjacent solutions a buyer might choose instead
- Aspirational or premium competitors: help you locate the ceiling of your positioning map
2. Prioritize before you collect anything
Don’t try to price-check your entire catalog; instead, consider conducting a SKU profitability analysis to focus on the most impactful items first. Identify your Key Value Items, the SKUs or plans buyers use to judge whether you’re expensive, and start there. A structured KVI approach keeps a retailer or SaaS team from drowning in low-impact comparisons. If you sell physical goods, pair this with a look at which SKUs actually drive margin, not just revenue, before you decide what’s worth tracking closely.
3. Collect the data and verify it
Pull prices from public pages, marketplaces, and reseller listings. Cross-check anything that looks unusual with a second source. For enterprise deals, supplement with win/loss notes and sales conversations, since list price and negotiated price are rarely the same number.
4. Normalize into comparable units
This is where most competitive pricing analysis breaks down. A competitor charging per seat, another charging per API call, and a third bundling everything into three flat tiers cannot be compared on sticker price alone. Map every offer into one consistent unit, whether that’s cost per month per active user or cost per 1,000 transactions, and record the model metadata alongside the number so you remember how you got there.

5. Analyze: build a price index and layer in demand signals
Calculate a price index (your price divided by the competitive median, times 100) across your prioritized list. Then layer in elasticity or willingness-to-pay data so you know not just where you sit, but how sensitive demand is at that position.
6. Simulate before you recommend
Model the financial impact of a proposed price change against last quarter’s volume before you ship it. This step turns your analysis from reactive price matching into a proactive strategy, and it catches costly mistakes before they reach a live price page.
7. Write an explicit recommendation with guardrails
State the number, the reasoning, and the conditions under which you’d revisit it (a competitor’s price move beyond a certain threshold, a margin floor being breached, and so on).
| Analysis component | What it captures | Refresh trigger |
|---|---|---|
| Pricing comparison matrix | Model, entry price, volume discounts, enterprise price, annual discount | Quarterly or after a known competitor change |
| Data source log | URL/contact, retrieval date, confidence level, collection method | Every data pull |
| Price index | Your price versus competitive median, by SKU tier | Quarterly baseline |
| Simulation output | Projected margin/volume impact of a proposed change | Before every price change |
Which Pricing Methodology Should Anchor Your Recommendation?
Three methodologies answer three different questions, and the strongest recommendations use all three together rather than picking just one.
Cost-plus pricing sets your floor. Calculate a fully loaded unit cost, including production or delivery, support overhead, and allocated customer acquisition cost, then add your target margin. Anything below this number destroys value regardless of what competitors charge.
Competitive parity sets your reference point. This is the price index work from the previous section: where do you sit relative to the market median for comparable offers, and does that position match your intended brand tier?
Value-based pricing sets your ceiling, using what buyers are actually willing to pay. Van Westendorp’s price sensitivity meter and the Gabor-Granger method are the standard tools here, and both typically need only 30 to 50 respondents per segment to produce an actionable curve. That’s a modest research lift for the pricing confidence it buys.
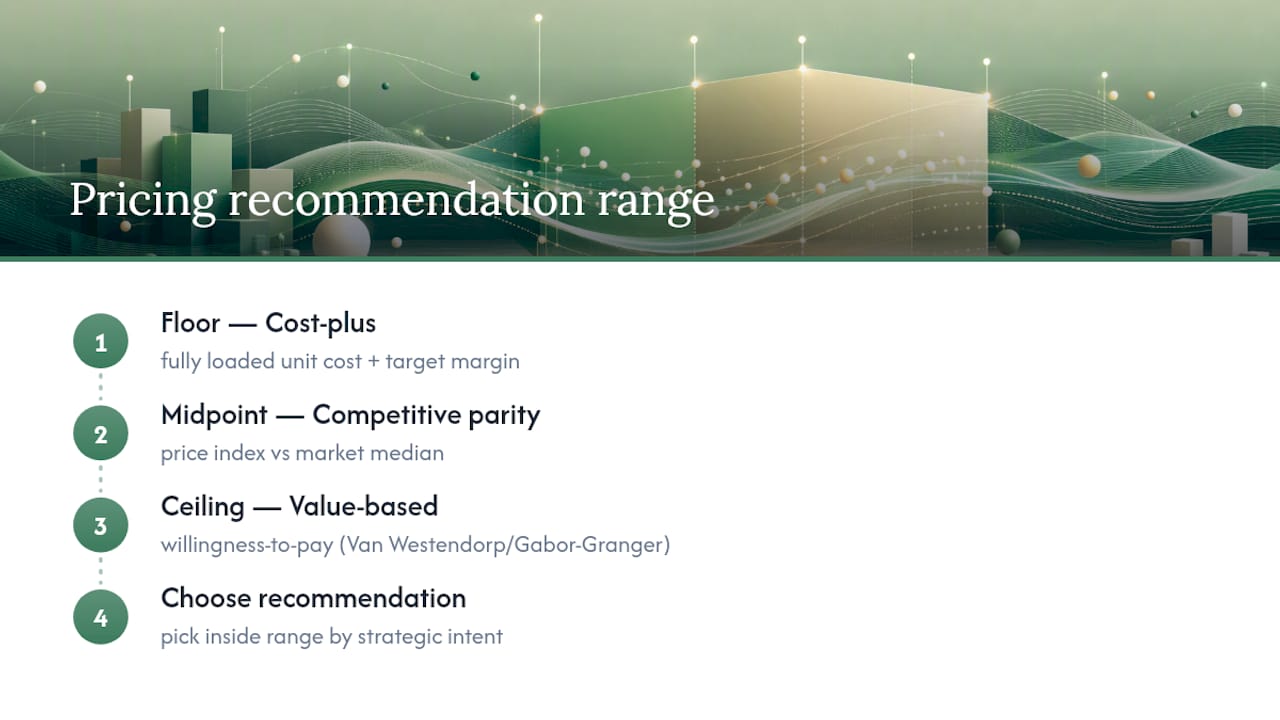
The real work is reconciling the three. If your cost-plus floor sits above what willingness-to-pay data says buyers will accept, you have a cost problem, not a pricing problem. If competitive parity puts you well below your value-based ceiling, you’re likely leaving margin on the table. Build a simple range: floor from cost-plus, midpoint from competitive parity, ceiling from value-based research, then pick your recommendation inside that range based on strategic intent (growth versus margin capture).
How Often Should You Refresh and Who Signs Off?
A data source log is what keeps a pricing analysis from becoming stale folklore that nobody trusts six months later. Track five fields for every price point you collect: source URL or contact, retrieval date, confidence level (high, medium, or low), collection method (scrape, API, or mystery shop), and any relevant notes.
On cadence and ownership:
- Run a full baseline refresh quarterly for most categories
- Move to monthly or even weekly tracking for fast-moving, promotional categories like retail or subscription software with frequent plan changes
- Route any recommended price change through pricing, product, and revenue operations for sign-off before it goes live
- Feed win/loss data from sales back into the model every cycle. If reps are consistently losing deals at a specific price point, that’s a live signal your index missed.
How Does Prowl Operationalize Competitive Pricing Analysis?
Manually pulling prices from a dozen competitor sites, normalizing units, and building a price index takes a pricing analyst days. Prowl connects any AI agent to 444 market intelligence tools through one API, which turns that multi-day pull into a repeatable workflow you can run every quarter without rebuilding it from scratch.
In practice, that means:
- Pulling and normalizing competitor pricing pages, reseller listings, and public plan tiers in a fraction of the manual research time
- Running price-index and willingness-to-pay simulation inputs without switching between five separate tools
- Generating the data source log automatically as part of each report, so confidence levels are documented rather than remembered
- Producing the comparison matrix as a ready deliverable instead of a manual spreadsheet rebuild
Sergey has documented case studies of pricing teams cutting analysis turnaround from weeks to days using this approach; details are available on request.
How Do Customer Demographics Shape Your Pricing Recommendation?
A price index tells you where you sit against competitors. It doesn’t tell you whether the segment paying the highest price is the segment you actually want to keep. That’s where demographic and behavioral data earns its place in the analysis.
Segment your willingness-to-pay research the same way you segment your customer base, not as one blended average. A Van Westendorp curve run across your entire user list will smooth over real differences between, say, a price-sensitive small business buyer and an enterprise buyer who cares more about support and integrations than the sticker price. Run the sensitivity meter separately for each meaningful segment, even if that means a slightly smaller sample per group.
Layer in usage and purchase-history data where you have it. Customers who use a product heavily but sit on your cheapest plan are a signal that your packaging, not your pricing, has a gap. Customers who churn right after a renewal price increase tell you where your ceiling actually is, which is more reliable than any survey.
Geography matters too. A price that clears easily in one region can be well above local purchasing power in another, and competitive sets often differ by region as well, so the “competitive” price you’re benchmarking against might not even be the right comparison set for every customer group. Build your positioning map per major region or segment rather than assuming one global number describes every buyer.
How Do You Track Competitor Price Changes in Real Time?
Quarterly analysis catches structural pricing decisions. For that, you need a tighter, faster-moving layer of monitoring sitting on top of your quarterly baseline.
Set up automated alerts on your prioritized KVI list specifically, not your entire catalog. Tracking every SKU in real time generates so much noise that teams stop reading the alerts within a month. Focus the tight-cadence tracking on the handful of items that actually move buyer perception of your pricing.
Combine automated feeds with a scheduled human spot-check, weekly for volatile categories like retail and subscription software, monthly for slower-moving B2B categories. Automated tools are excellent at telling you a number changed. They’re not always reliable at telling you why, and a price change tied to a packaging shift or a new tier structure needs a person to interpret it correctly before anyone reacts to the alert.
That threshold discipline is what keeps real-time tracking useful instead of turning into a constant, low-value distraction for the pricing team.
What Do Successful Competitive Pricing Analyses Look Like in Practice?
The pattern in effective competitive pricing work isn’t a single brilliant insight. It’s a disciplined sequence: prioritize, normalize, simulate, then act.
A retail team dealing with margin pressure on a core product line, for instance, would typically start by identifying its true Key Value Items, the dozen or so SKUs shoppers use to judge whether the whole store is expensive, rather than trying to reprice a full catalog at once. Normalizing those prices against competitors’ equivalent SKUs, then simulating a modest price adjustment against historical volume before committing, is what separates a defensible pricing move from a reactive one that gets reversed two weeks later.
A B2B software team facing a similar packaging question would follow the same logic in a different shape: mapping competitor per-seat pricing against its own tiered structure, running a willingness-to-pay study across its two main customer segments separately, and finding that its mid-tier plan sat well below the value-based ceiling for its power-user segment. The fix wasn’t a blanket price increase. It was a repackaging that moved specific features into a higher tier, informed directly by the positioning map work.
What both examples share is the refusal to treat competitive pricing analysis as a one-time project. Each treated the price index and comparison matrix as living documents, revisited on a set cadence, with every price change simulated before it shipped and logged with a confidence level afterward.
What Do Teams Get Wrong About Competitive Pricing Analysis?
The most common mistake is chasing every competitor move instead of prioritizing the handful of KVIs that actually shape buyer perception. Teams that react to every price change burn analyst time on noise. My priority order for a new program: days 1 to 30, build the data source log and prioritized KVI list; days 30 to 90, run your first price index and a willingness-to-pay study on one segment; days 90 to 180, add simulation before any live price change and set your quarterly cadence. Govern first. Automate second. Never skip the simulation step.
— Sergey
Let Prowl Handle the Data Pull So You Can Focus on the Recommendation
Every step in this guide, from competitor identification through price-index normalization and willingness-to-pay simulation, takes analyst hours to do by hand and takes minutes when it’s routed through one connected system. Prowl links any AI agent to 444 market intelligence tools through a single API, so the collection, normalization, and comparison-matrix work you’d otherwise rebuild every quarter becomes a workflow you run on demand.

If you’re scoping your first prioritized KVI list this quarter, start by seeing how a pricing report comes together in practice on the Prowl use cases page, then connect your own agent through getting started once you know what you want it to pull.
Sources
- Competitor price analysis: the complete guide (with examples!)
- Competitive pricing analysis: a step-by-step guide for retailers
- Competitive Pricing Analysis Template: A Complete Guide
- What is competitor price monitoring?