
Growth analytics is the discipline of tracking acquisition, activation, retention, revenue, and efficiency metrics together to find which levers actually move sustainable company growth. It powers decisions such as where to put next quarter’s marketing budget, which experiments deserve engineering time, and how confidently a founder can forecast revenue. The five metric categories below cover everything from CAC to churn, and each one answers a different question about where growth is really coming from.
TL;DR:
- Fragmented data stacks and mismatched time windows can lead to slow insights and unreliable growth decision-making.
- Prioritizing activation rate, week-4 retention, and channel CAC provides a stable foundation in the first 90 days of growth tracking.
- Connecting acquisition, behavioral, and revenue data into a unified environment drastically shortens analysis cycles and improves confidence.
- Using funnel and cohort analysis reveals specific leaky steps and behavior patterns driving or hindering growth.
- Growth strategies should directly incorporate channel-specific CAC, cohort retention, and customer lifetime value to optimize marketing and sales budgets.
Table of Contents
- What Growth Analytics Covers and Why It Matters
- Core Growth Metrics and How to Calculate Them
- Funnel and Cohort Analysis: Finding Where Growth Actually Comes From
- How Should You Structure Growth Dashboards?
- How to Implement Growth Analytics in Your Organization
- A Practical Example: Consolidating Data to Shorten Insight Cycles
- Integration of Growth Analytics With Marketing and Sales Strategies
- What Should You Prioritize in Your First 90 Days of Growth Analytics?
- Get Consolidated Growth Analytics Running Without the Tool Sprawl
- Sources
What Growth Analytics Covers and Why It Matters
Growth analytics spans the full path from first touch to renewal: acquisition, activation, retention, revenue, and efficiency. Most teams track pieces of this in isolation. Marketing owns acquisition dashboards, product owns activation funnels, finance owns revenue reports, and nobody owns the connections between them. That gap is where bad decisions get made.
The categories break down like this, and each one answers a different question:
- Acquisition — how many new users or customers show up, and through which channel
- Activation — how many of them reach a meaningful first-use moment
- Retention — how many sticks around past 30, 90, or 365 days
- Revenue — how much money flows from the customers you kept
- Efficiency — how much it costs to generate each dollar of that revenue
Growth metrics fall cleanly into these five buckets, and retention and activation tend to matter most for early-stage decisions because they’re the hardest to fake with a bigger ad budget, according to a breakdown from Kissmetrics. Acquisition and efficiency numbers matter more once you’re scaling and need to know if growth is actually profitable.
The reason unified data matters so much comes down to speed and confidence. When acquisition data lives in an ad platform, activation data lives in a product analytics tool, and revenue data lives in a billing system, answering a question like “which channel produces customers with the best 90-day LTV” can take a week of exporting spreadsheets and hoping the join keys match. A connected data environment turns that into a query that runs in minutes, which changes how often teams actually ask the question in the first place, per Databricks.
Three pitfalls show up in nearly every growth analytics setup:
- Fragmented stacks that force manual stitching between ad platforms, product tools, and billing systems
- Vanity metrics like total signups or pageviews that rise even when the business isn’t actually healthier
- Mismatched time windows where a 7-day retention number gets compared against a 30-day cohort from a different report
Pro Tip: Before building a single dashboard, write down the exact business decision each metric is supposed to inform. If you can’t name the decision, the metric probably belongs on a secondary report, not the one leadership checks every Monday.
Core Growth Metrics and How to Calculate Them
Every growth metric answers a specific question, and picking the wrong formula or window is the fastest way to make a bad call look confident. Here are the calculations that show up in nearly every serious growth review, along with when to use each one.
- Growth rate — (Ending value − Starting value) / Starting value × 100. Use month-over-month (MoM) for fast signals on a young product, quarter-over-quarter (QoQ) for medium-term trend checks, and year-over-year (YoY) when you need to strip out seasonality, according to Shopify’s breakdown of these windows.
- CAGR (compound annual growth rate) — (Ending value / Starting value)^(1/number of periods) − 1. This smooths multi-year growth into a single annualized number, which is useful for board decks but can flatter a business that had one huge year and two flat ones.
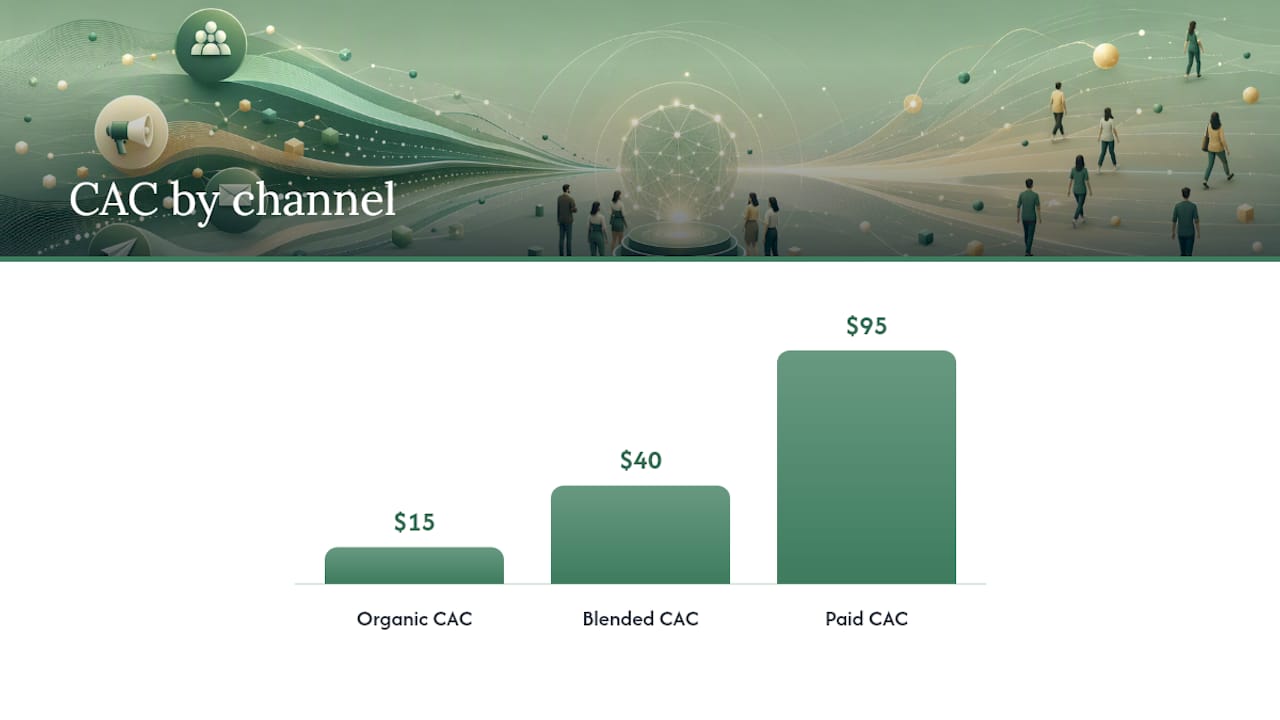
- CAC (customer acquisition cost) — total acquisition spend divided by new customers acquired, ideally segmented by channel. A blended CAC across paid social, SEO, and referrals hides which channel is actually working.
- LTV (lifetime value) — average revenue per customer multiplied by average customer lifespan, adjusted for gross margin. Rough versions ignore margin; better ones don’t.
- LTV:CAC ratio — LTV divided by CAC. A ratio below 1:1 means you’re losing money on every customer. A ratio well above 3:1 often signals you’re underspending on acquisition, not that you’re doing great.
- CAC payback period — CAC divided by average monthly gross margin per customer. This tells you how many months it takes to recoup what you spent to acquire someone.
- Net revenue retention (NRR) — revenue from existing customers this period divided by revenue from those same customers last period, including upgrades, downgrades, and churn.
- Activation rate — the percentage of new users who complete a defined “aha moment” action, like sending a first message or completing setup.
- Churn rate — customers or revenue lost in a period divided by the total at the start of that period, tracked separately for logo churn and revenue churn.
Growth rate = ((ending − starting) / starting) × 100 is the formula worth memorizing above all others, because nearly every other metric on this list is a variation of it applied to a different denominator.
Picking the right window and denominator matters more than the math itself. A SaaS company comparing this month’s revenue to last month’s will see wild swings around renewal dates; comparing YoY smooths that out. Segmenting CAC by channel instead of blending it can reveal that your “efficient” $40 blended CAC is actually a $15 organic channel propping up a $95 paid channel that’s quietly losing money.
The most common misuse is drawing conclusions from a small base. Investopedia’s explainer on growth rate interpretation flags this exact trap: growth rates on small numbers are volatile and often meaningless until the base stabilizes. Cherry-picked intervals cause the same problem in the other direction, where a company reports its best single quarter as if it were the trend.
Funnel and Cohort Analysis: Finding Where Growth Actually Comes From
Funnel analysis and cohort analysis are the two methods that turn a pile of growth metrics into an actual diagnosis. A growth rate tells you something changed. A funnel or cohort tells you where and, often, why.
Building a funnel starts with mapping the real steps a customer takes, not the steps you wish they took. A typical B2B funnel might run: visited pricing page, started trial, invited a teammate, completed core setup, converted to paid. Each step needs its own tracked event, and the step-level drop-off (not just the overall conversion rate) is where the useful signal lives.
Conversion funnel analysis works by isolating the single step causing the largest drop-off, since that’s usually where fixing one thing produces the biggest lift, according to UXCam’s guide to the method. Once you’ve found that step quantitatively, session replay tools or direct user interviews tell you why people are dropping off there. The funnel number alone won’t tell you which.
Cohort analysis adds the second dimension: time. Instead of asking “what’s our retention rate,” you group users by signup week or month and track how each group behaves over time. This produces a retention curve, and the shape of that curve matters more than any single number. A curve that flattens after month three suggests you’ve found a stable core of users; a curve that keeps declining toward zero means something’s structurally broken.
Combining cohort and funnel data lets you attribute LTV back to acquisition source. Group customers by acquisition channel and signup month, then track each cohort’s retention and revenue over 90, 180, and 365 days. This is how you discover that a channel with a higher CAC actually pays back faster because its customers retain at twice the rate of your cheapest channel.
A few practical notes on running this well:
- Instrument events before you need them; retrofitting tracking onto a funnel loses months of historical data
- Segment cohorts by more than just signup date when the sample size allows it (plan type, channel, company size)
- Re-run funnel diagnostics every time you ship a change to onboarding, not just quarterly
- Give each experiment a fixed measurement window (usually 2 to 4 weeks) before calling a result
Pro Tip: Run cohort retention analysis before you run funnel optimization. Fixing a leaky signup step is wasted effort if the users who do make it through aren’t sticking around anyway.
How Should You Structure Growth Dashboards?
Dashboards fail for one of two reasons: too many metrics with no clear owner, or the right metrics on the wrong cadence. Three dashboard types solve three different problems, and mixing them up is the most common design mistake.
Operational dashboards run daily or weekly and cover things like signups, activation events, and support ticket volume. Tactical dashboards run weekly or monthly and track channel-level CAC, activation rate trends, and short-term retention curves. Strategic dashboards run monthly or quarterly and cover NRR, LTV:CAC by segment, and CAC payback period, the numbers a board actually wants to see.
A weekly growth dashboard should stay narrow: new signups by channel, activation rate, week-1 retention, and any active experiment’s headline metric. A monthly or quarterly deck earns more room for LTV:CAC by cohort, churn broken out by reason, and revenue growth rate against forecast.
Dashboards work best capped at 5 to 7 metrics, each with a named owner and a threshold that triggers a specific action when crossed, rather than a wall of 20 numbers nobody’s accountable for, per Kissmetrics’ guidance on dashboard design. Order those metrics by what can’t simply be bought, like retention and activation, ahead of what can be bought, like raw signup volume.
On the tooling side, the real decision is architecture, not brand:
| Approach | Strength | Trade-off |
|---|---|---|
| Unified data environment (warehouse or MCP) | Fast cross-system queries, one source of truth | Requires upfront integration work |
| Stitched point tools | Fast to start, familiar interfaces | Manual joins, data lag, version drift between reports |
A partner resource worth reviewing on the tooling side is Epicware’s rundown of growth tools for email, social, and SEO, which is useful when you’re mapping which channel tools need to feed into your central reporting layer.
When evaluating any tool or platform, four criteria matter more than feature lists: data latency (how fresh is the number when you look at it), native cohort support (can it group by signup date without a workaround), event model flexibility (can it track your actual product, not a generic template), and queryability (can someone outside the data team ask a new question without filing a ticket).
How to Implement Growth Analytics in Your Organization
Rolling out growth analytics without clear ownership produces a graveyard of abandoned dashboards within two quarters. The fix is assigning roles before you assign metrics.
- Name a growth lead who owns the overall metric framework and reports it on a fixed cadence, even if that person also has another title.
- Assign an analytics engineer or data-savvy operator to maintain the tracking plan, the event schema, and data quality checks.
- Give product, marketing, and finance each a metric they’re accountable for (activation, CAC, and unit economics respectively) so no single team owns everything or nothing.
- Build a tracking plan document before instrumenting anything: list every event, its properties, and which metric it feeds.
- Set a reporting cadence and stick to it: weekly checks on acquisition and activation, monthly deep dives on retention and churn, quarterly reviews of unit economics and forecast accuracy.
- Establish one source of truth for each metric definition, written down, versioned, and referenced by name in every meeting so “retention” means the same thing to marketing and product.
Governance sounds bureaucratic until the first time two departments present contradicting churn numbers in the same meeting. A versioned tracking plan, consistent naming conventions (is it “MRR churn” or “revenue churn,” and do they mean the same thing?), and a single dashboard of record solve that before it happens. For leaders trying to diagnose why growth has plateaued despite good intentions, The AI Orchestrators’ guide to growth stalls walks through the organizational patterns that tend to cause it.
A Practical Example: Consolidating Data to Shorten Insight Cycles
The bottleneck in most growth analytics setups isn’t a lack of data. It’s the time between having a question and getting a trustworthy answer. Connecting acquisition, behavioral, and revenue data into one queryable environment turns a multi-week analysis into a same-day one, because the join work that used to eat an analyst’s week happens automatically.

Prowl approaches this by giving any agent or workflow access to 444 market-intelligence tools through a single connector, so a question like “what’s 90-day LTV by acquisition channel” or “model our CAC payback under three pricing scenarios” can be answered as a generated report instead of a manual export-and-merge job. Representative workflows include cohort LTV breakdowns by channel, payback modeling, and automated recurring reports.
Integration of Growth Analytics With Marketing and Sales Strategies
Growth analytics only pays off once marketing and sales start acting on it, not just reading it. The clearest integration point is budget allocation: channel-level CAC and cohort LTV data should directly inform how next quarter’s ad spend gets split, rather than defaulting to “what we spent last quarter plus 10%.” A channel with a higher upfront CAC but a faster payback period and stronger retention often deserves more budget than a cheaper channel whose customers churn within 60 days.
Sales teams benefit from the same data in a different shape. Feeding activation and early-usage signals back to sales helps them prioritize outreach toward accounts showing genuine product engagement instead of just contract size. Renewal conversations get sharper too when a rep can see a customer’s actual usage trend heading into a renewal date, rather than finding out about disengagement after the cancellation email arrives.
Referral and partner channels deserve their own line in this integration. Statista’s data on referral program performance in North America is a useful comparator when deciding how much weight referral-driven leads should get against paid channels in the same acquisition dashboard.
When presenting these numbers upward, granularity matters. BabyLoveRaise’s guide to per-slide analytics for pitch decks makes a point that applies just as well to internal growth reviews: a single summary metric per slide or per report section, tied to the specific decision it should inform, lands better with stakeholders than a dense spreadsheet dump.
What Should You Prioritize in Your First 90 Days of Growth Analytics?
If I were starting from scratch, I’d track three things in the first 90 days: activation rate, week-4 retention, and CAC by channel. Everything else is noise until those three are stable and understood. Activation tells you if the product delivers its core value fast enough. Week-4 retention tells you if that value sticks. Channel-level CAC tells you whether growth is even affordable.
Quick wins come from funnel fixes, since a single leaky step is usually visible within two weeks of instrumenting a funnel properly. Long-term investment goes into the tracking plan and data architecture, which pays off slowly but compounds.
Use the quick wins to buy time for the long-term work. A fixed funnel leak that lifts conversion by even a few points is an easy story to tell leadership when you’re asking for headcount or budget to build the unified reporting layer that took longer to show results.
— Sergey
Get Consolidated Growth Analytics Running Without the Tool Sprawl
Most teams solve fragmented growth data by adding another point tool, which usually just adds another login and another export step. Prowl takes the opposite approach: one connector giving any AI agent or workflow access to 444 market-intelligence tools, so cohort LTV by channel, CAC payback modeling, and competitor benchmarking come back as a finished report instead of a week of manual joins.

It fits two jobs particularly well: heads of growth who need channel-level LTV answers before the next budget meeting, and analysts who are tired of rebuilding the same report every month by hand. Explore the use cases for examples of the reports teams generate with it, or head straight to getting started to connect your first agent and run a report today.
Sources
- Growth analytics is what comes after growth hacking | Databricks Blog
- How to calculate growth rate (Shopify)
- Conversion funnel analysis: a complete guide for 2026 | UXCam
- Growth metrics: what to track, formulas, and benchmarks | Kissmetrics
- Statista — B2B referral programs effect on sales/marketing