
Benchmarking ad performance means comparing your account’s cost, click, and conversion metrics against percentile ranges from thousands of other campaigns to see whether spend is actually earning margin, not just clicks. The headline signal for 2026: clicks are cheapest on TikTok and Meta, but intent runs highest on Google Search and Amazon, where shoppers convert faster once they land. Once you know your channel’s median and P75, the next move is simple: pull your account numbers and see where you fall.
TL;DR:
- Brand-new accounts should only aim for the median or P75 benchmark levels within three to six months, adjusted for margin and business type.
- Creative quality influences 70 to 80 percent of ad performance variance, making creative testing the top priority for fixing underperformance.
- Automating benchmark collection with tools like Prowl MCP reduces manual work, ensures consistent data mapping, and provides real-time anomaly alerts.
- A solid attribution window check across all platforms is essential before comparing internal metrics to external benchmarks to avoid misleading conclusions.
Table of Contents
- What Metrics Belong in an Ad Performance Benchmark?
- Where Do the Major Ad Platforms Stand in 2026?
- How Do You Collect Data You Can Actually Compare?
- How Do You Turn a Benchmark Into a Target?
- Automating Benchmark Collection With Prowl MCP
- Why Benchmarks Are a Starting Point, Not a Scoreboard
- Let Prowl Handle the Benchmark Grunt Work
- Where to Verify These Numbers Yourself
- Sources
- FAQ
What Metrics Belong in an Ad Performance Benchmark?
A useful benchmark rests on a small set of metrics measured the same way every time. Get the definitions wrong and you’ll compare apples to oranges across platforms, which is the single fastest way to draw the wrong conclusion from good data.
Here’s the working vocabulary, with the formulas that matter:
- Impressions and reach: impressions count every ad view, including repeats; reach counts unique viewers. Confusing the two inflates perceived scale.
- CPM (cost per mille): (spend ÷ impressions) × 1,000. Your baseline cost of visibility before anyone clicks.
- CPC (cost per click): spend ÷ clicks. The price of attention, not intent.
- CTR (click-through rate): clicks ÷ impressions. A creative and relevance signal more than a targeting one.
- CVR (conversion rate): conversions ÷ clicks. This is where landing pages and offer strength show up.
- CPA (cost per acquisition): spend ÷ conversions. The number most budget conversations revolve around.
- ROAS (return on ad spend): revenue ÷ spend, expressed as a ratio (4x) or percentage (400%).
- MER (marketing efficiency ratio): total revenue ÷ total marketing spend, across all channels combined. Unlike ROAS, MER can’t be gamed by shifting attribution between platforms.
- AOV (average order value) and LTV:CAC (lifetime value to customer acquisition cost) push the analysis past the click and into whether the business model actually works.
Platforms complicate this. Meta calls a purchase a “result,” Google calls it a “conversion,” and both let you set attribution windows that quietly reshape your numbers, as Mailchimp’s advertising metrics guide lays out. A 7-day click window on Meta will report more conversions than a 1-day click window on the same campaign, with zero change in actual sales. Match the metric to the objective: CTR and CPM for awareness plays, CVR and CPA for lead generation, ROAS and MER for revenue campaigns, as the AppsFlyer measurement guide recommends.
Where Do the Major Ad Platforms Stand in 2026?
Cross-industry averages from the Silverback Marketing 2026 Paid Media Benchmark Report put Google Search average CPC between $2.96 and $4.22, with average CTR at 3.52%, average CVR at 4.40%, and average CPA at $53.52. Those are blended medians across industries, not targets, and every vertical shifts them meaningfully.
Think of the channel landscape in three tiers: intent capture, discovery, and hybrid.
- Google Search sits at the top of intent. High CPCs, but conversion rates that justify them because searchers already want what you sell.
- Performance Max (blended) mixes Search, Display, YouTube, and Shopping inventory into one campaign type, which means its blended CPA and ROAS numbers sit between pure Search and pure Display performance. Compare it to itself over time more than to Search alone.
- Meta (Facebook/Instagram) delivers cheaper CPMs and CPCs than Search but lower purchase intent. It rewards strong creative more than any other major channel, since users aren’t searching for your product when the ad appears.
- Microsoft/Bing often quietly beats Google on CPC in mid-funnel B2B and older-demographic verticals, with less competition driving prices down.
- LinkedIn runs the highest CPCs of any major platform, often several times Google’s, but B2B lead quality and deal size can justify it.
- TikTok offers the cheapest reach for younger demographics, with CTR that can exceed Meta’s, though conversion rates lag until the funnel and pixel maturity catch up.
- Amazon Ads benefits from shopping-ready traffic. CVR tends to run higher than any other channel because the click already happens inside a purchase environment.
- OpenAI/ChatGPT ad placements are the newest entrant and still building a stable benchmark dataset; early volume is thin enough that most practitioners should treat any numbers there as directional, not authoritative.
Industry skew matters more than channel choice alone. E-commerce accounts typically see higher CVR and lower CPA than B2B software accounts running the identical platform, simply because purchase cycles differ. If you want quick wins, look at the gap between where clicks are cheap (TikTok, Meta) and where intent is high (Google, Amazon), and test budget shifts between them rather than assuming one channel is universally “better.”
How Do You Collect Data You Can Actually Compare?
Benchmarking only works if your internal numbers are built the same way as the external ones you’re comparing against. That takes three ingredients: trusted sources, a mapping checklist, and a reporting cadence tied to the right primary KPI.
Combine platform native exports (Google Ads, Meta Ads Manager) with your analytics platform and at least one third-party benchmark report, then reconcile the gaps. Native platform numbers tend to run optimistic because of self-attribution; your analytics platform usually reports lower, more conservative conversion counts. Neither is “wrong,” they’re measuring different windows.
Before you compare anything, run this mapping checklist:
- Confirm currency consistency if you run multi-market accounts.
- Standardize your conversion definition (a form fill and a completed purchase are not the same “conversion”).
- Fix a single attribution window across every platform you report on.
- Use consistent campaign and metric naming so a monthly rollup doesn’t require manual translation.
Cadence should follow decision speed, not habit. The AdSights Paid Media Metrics Handbook maps this cleanly: daily checks watch spend pacing and anomaly flags, weekly reviews track creative CTR and frequency decay, monthly reports focus on MER, ROAS, and CPA, and quarterly reviews step back to LTV:CAC and incrementality testing like holdouts or marketing mix modeling.
Pro Tip: Pick one primary KPI per report and stick to it. A monthly deck that leads with five metrics forces the reader to pick their own headline, and usually they pick the wrong one.
How Do You Turn a Benchmark Into a Target?
Percentile bands do the real work here. Treat the median as your floor, P75 as your near-term goal, and the elite band as the ceiling you build toward as creative and account maturity improve, an approach the Benchmarketing Google Ads benchmark data frames explicitly around percentile bands rather than single averages.

A brand-new account with untested creative shouldn’t be judged against elite benchmarks; give it three to six months before expecting P75 performance. Margin matters too. A 3x ROAS target means something different for a 70% margin software product than for a 15% margin retail product, so adjust the number to your unit economics before you hand it to a media buyer as a goal.
When a metric misses its band, work through diagnosis in order rather than guessing:
- Creative: is CTR below median? Test new hooks and formats before touching bids.
- Audience: is CTR fine but CVR weak? The click is landing on the wrong person.
- Landing page: is CVR weak with good audience fit? Check load speed and message match.
- Bid strategy: is spend pacing erratically? Check learning-phase resets and budget caps.
- Attribution: does ROAS look wrong compared to actual revenue? Recheck your conversion window before blaming the channel.
Fix creative first. Search Engine Journal’s analysis estimates creative quality drives 70 to 80 percent of performance variance, which means most underperformance problems aren’t bidding problems at all.
Automating Benchmark Collection With Prowl MCP
Manually pulling exports from six ad platforms, aligning naming conventions, and recalculating percentile positions every week is exactly the kind of repetitive, error-prone work that eats a media team’s time. The platform connects an AI agent to hundreds of market-intelligence tools through a single MCP, pulling ad performance data alongside SEO and competitor signals into one normalized workflow instead of six separate logins.
Practical uses look like this:
- A weekly benchmark report that pulls CTR, CPA, and ROAS across accounts and flags anything outside the P25 to P75 band.
- Anomaly alerts when spend pacing or CPA jumps outside historical norms mid week.
- Automated percentile calculations that update as new industry benchmark data gets published, rather than waiting for a quarterly manual refresh.
Pro Tip: Never trust a platform-reported ROAS at face value. Check the attribution window it’s using and cross-reference creative-quality signals before you present the number to a client or executive.
Automation removes the grunt work of assembly. It doesn’t remove the judgment call of deciding whether a number is actually good, which still comes down to the diagnostic thinking above.
Why Benchmarks Are a Starting Point, Not a Scoreboard
Most media teams treat benchmarks the way students treat a grading curve. Hit the median, feel fine, move on. That’s backwards. A benchmark tells you where the pack sits, not where your account should sit given your margin structure, your creative investment, or your audience maturity.
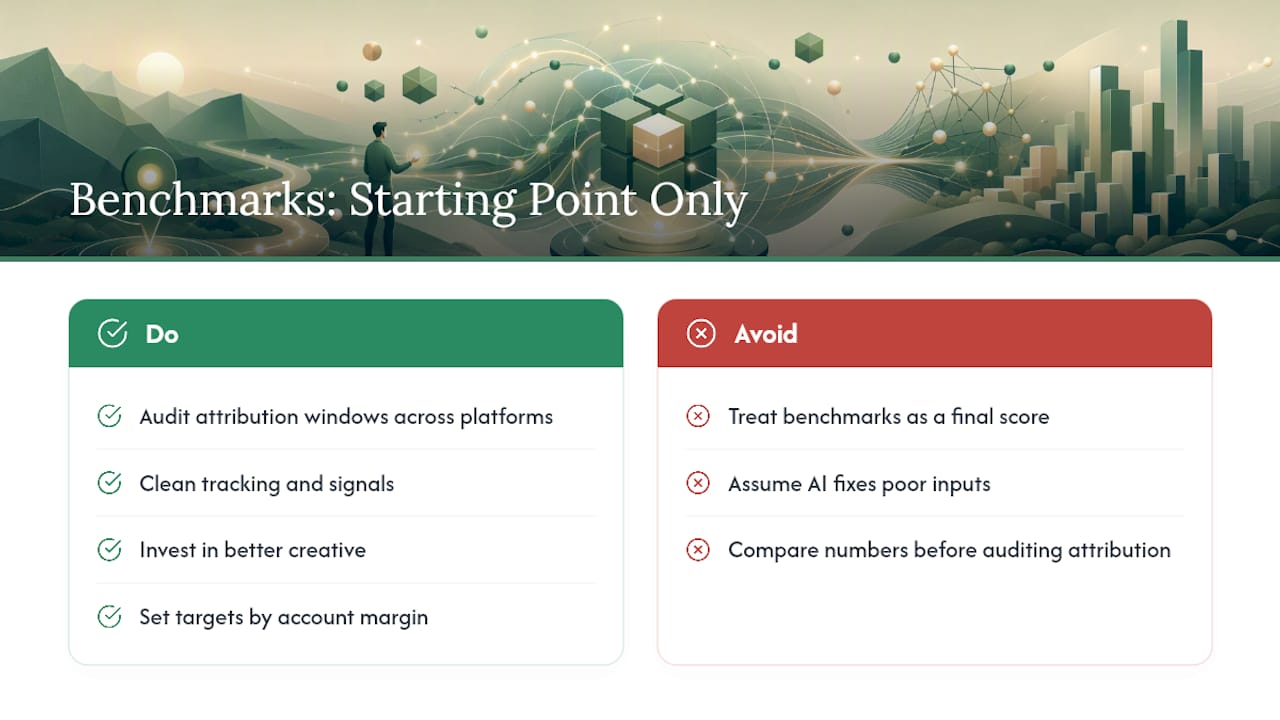
The bigger shift in 2026 is that AI bidding is now the default setting, not the advanced option. Performance Max, Advantage+, and similar automated systems handle the bid math. What they can’t do is invent good creative or fix a broken conversion definition. The upstream inputs, clean tracking, sharp creative, honest attribution windows, matter more now than they did when marketers were manually adjusting bids, because a bad signal fed to an AI bidder gets amplified faster than a human ever could.
If you take one action from this piece, make it this: audit your attribution windows across every platform before you compare a single number to a benchmark report.
— Sergey
Let Prowl Handle the Benchmark Grunt Work
This solution is an alternative to spending hours every Monday copying numbers out of multiple ad dashboards into one spreadsheet. Connecting an AI agent to a market intelligence MCP can pull ad performance, SEO, and competitor data through a single API, normalizing metric definitions and attribution windows so your weekly benchmark report builds itself instead of consuming an analyst’s morning.

That matters most for agencies and growth teams juggling multiple client accounts, where the reconciliation work described above (currency, conversion definitions, naming conventions) multiplies with every new account added. Instead of rebuilding that mapping checklist by hand each time, an agent running on Prowl’s market-intelligence platform applies it automatically across every connected source. If you want to see how teams are already using this for reporting and competitor tracking, the use cases page walks through real workflows, and getting started takes about the same time as pulling one manual export.
Where to Verify These Numbers Yourself
Cross-check any benchmark before you build a target on it. Confirm the sample size, the date range, and whether the report blends industries or segments them.
- Silverback Marketing’s 2026 Paid Media Benchmark Report for cross-channel CPC, CTR, CVR, and CPA ranges.
- Mailchimp’s advertising metrics guide for formula definitions and objective alignment.
- AppsFlyer’s ad metrics guide for measurement mapping across platforms.
- Additional digital ad campaign best practices for 2026 for channel-specific execution tips.
Sources
- 2026 Paid Media Benchmark Report | Silverback Marketing
- Mailchimp — Advertising metrics (guide)
- AppsFlyer — Understanding ad metrics: A guide for digital marketers
FAQ
How Do You Measure Ad Performance?
Track a small consistent set of metrics, CTR, CVR, CPA, and ROAS or MER, using the same conversion definition and attribution window across every platform, then compare those numbers against percentile benchmarks for your industry.
How Do You Benchmark Performance?
Pull your account’s own CPC, CTR, CVR, and CPA, then compare each against published median and P75 ranges for your channel and industry, treating the median as a floor and P75 as a near-term target rather than a hard pass/fail line.
What Are the Current Performance Benchmarks for Google Ads?
Cross-industry 2026 data puts average Google Search CPC between $2.96 and $4.22, average CTR at 3.52%, average CVR at 4.40%, and average CPA at $53.52, according to Silverback Marketing’s benchmark report, though individual verticals vary widely around those averages.
What Are the Five Phases of Benchmarking?
Definitions vary across sources, but a practical version for paid media covers defining your metrics, collecting comparable data, setting percentile-based targets, diagnosing gaps, and testing and re-measuring on a fixed cadence.
Can Automation Tools Help With Ad Benchmarking?
Yes. A platform like Prowl Agent connects to hundreds of intelligence tools through one MCP integration, pulling and normalizing ad performance data across platforms so teams spend less time on manual exports and more time acting on the diagnosis.