
Ad performance analysis works when it measures three layers at once: media (did the ad actually get seen), brand (did it change how people feel), and sales (did it move revenue). Prioritize conversion-based metrics, ROAS and CPA, alongside incrementality testing, over vanity numbers like raw impressions. Before anything else, confirm your conversion tracking is accurate and pick one primary KPI tied to the campaign’s actual business goal.
TL;DR:
- Prioritize conversion metrics like ROAS and CPA, ensuring your tracking is accurate and aligned with specific business goals before analyzing ad performance.
- Use reach, frequency, and CTR to evaluate prospecting campaigns, while relying on conversion rate, CPA, and ROAS for retargeting efforts.
- Separate evaluation into media, brand, and sales effectiveness layers, focusing on delivery, perception change, and revenue impact respectively, rather than solely last-click conversions.
- Regularly validate attribution and de-duplication methods, run incremental tests, and avoid trusting platform-reported conversions without proper verification.
- Automate data consolidation and reporting with AI-driven tools to reduce manual errors, speed up analysis, and maintain a single source of truth for all campaign metrics.
Table of Contents
- What Metrics Should You Track for Ad Performance Analysis?
- The Media, Brand, and Sales Framework Marketers Actually Need
- How Reliable Is Your Attribution and Conversion Tracking?
- Why Test Design Beats Attribution Guesswork
- How Do You Build a Cross-Channel Ad Reporting Dashboard?
- Turning Ad Performance Data Into Optimization Decisions
- How Automation Speeds Up Reliable Ad Performance Analysis
- How Clean Does Your Ad Data Need to Be Before You Trust It?
- How Much Should Statistical Noise Change Your Read on a Campaign?
- What Advanced Analytics Techniques Reveal That Basic Metrics Miss
- What Biases Distort Ad Performance Reports Most Often?
- Practical Habits That Turn Dashboards Into Decisions
- Get Consolidated Ad Reporting Without the Manual Spreadsheet Work
- Sources
What Metrics Should You Track for Ad Performance Analysis?
Every metric answers a different question, and using the wrong one is how teams optimize for the illusion of progress. Impressions count how many times an ad rendered; reach counts unique viewers; frequency is impressions divided by reach, telling you how often the same person saw it. Clicks and click-through rate (clicks divided by impressions) measure attention, while view-through rate captures video or rich-media engagement without a click.
Cost metrics tell you what you’re paying for that attention. CPC (spend divided by clicks) and CPM (spend per thousand impressions) measure media efficiency. CPA or CPL (spend divided by conversions or leads) measures acquisition efficiency, which matters more once a campaign leaves the awareness stage.
Outcome metrics close the loop: conversion rate (conversions divided by clicks or sessions), ROAS (revenue divided by ad spend), ROI (net profit divided by cost), and LTV (projected revenue per customer over their lifetime). AppsFlyer’s measurement guidance recommends pairing ROAS with LTV specifically for profitability calls, since a channel with a mediocre 30-day ROAS can still be your best performer if those customers stick around for years.
A prospecting campaign should be read on reach, frequency, and CTR, since the job is building an audience, not closing one. A retargeting campaign on the same account needs a completely different readout: conversion rate, CPA, and ROAS, because the audience already knows the brand and the only question is whether the ad closes the sale.
- Use rates (CTR, conversion rate) to compare creative and audience quality across different spend levels.
- Use absolute numbers (impressions, conversions) to judge whether you have enough volume for the rate to mean anything.
- A 50% conversion rate on four clicks tells you nothing; treat any metric built on fewer than 100 events as noise, not signal.
The Media, Brand, and Sales Framework Marketers Actually Need
Platform dashboards tempt you to judge everything on last click conversions, which is exactly how brand campaigns get killed for “underperforming.” The IAB Europe Digital Advertising Effectiveness Framework splits evaluation into three layers, and each one needs its own metrics and its own patience.
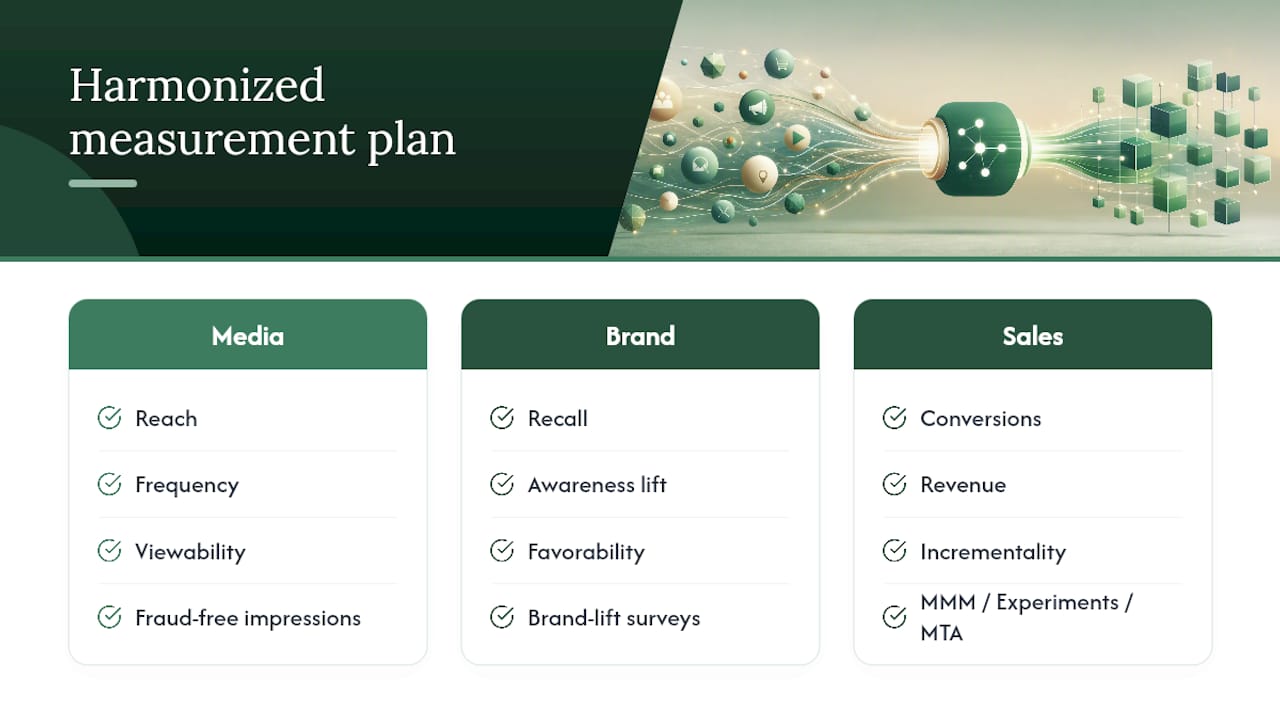
Media effectiveness asks whether the ad was actually delivered and seen. This layer runs on reach, frequency, viewability, and fraud-free impression rates. If this layer fails, nothing downstream matters, no amount of clever creative fixes an ad nobody saw.
Brand effectiveness asks whether the ad changed perception. This runs on ad recall, awareness lift, and favorability, typically measured through exposed-versus-control brand lift surveys rather than click data. Dynata’s research on measuring advertising effectiveness treats brand lift and performance metrics as complementary: lift shows intent forming, performance data shows whether that intent converts.
Sales effectiveness asks whether the ad drove revenue, using conversions, revenue, and incrementality as the core measures. Here you choose between marketing mix modeling (MMM) for long-term, market-level effects and controlled experiments or multi-touch attribution (MTA) for short-term causal proof.
A single measurement plan assigns one layer to each campaign objective, then reports all three together instead of letting one platform’s last-click number stand in for the whole picture. That’s the harmonized measurement language the industry has been pushing toward for years, and it’s still the fastest way to stop cross-functional arguments about whether a campaign “worked.”
How Reliable Is Your Attribution and Conversion Tracking?
Attribution models are only as trustworthy as the tracking feeding them, and most tracking setups have holes nobody’s checked in months.
- Standardize event names across platforms so “Purchase,” “purchase,” and “checkout_complete” don’t fragment the same conversion into three phantom events.
- Set up cross-domain tracking if checkout lives on a different subdomain or payment processor than the landing page.
- Move to server-side event tracking where possible, since browser-based pixels lose visibility as cookie restrictions tighten.
- Deduplicate conversions between platforms before trusting a “total conversions” number pulled from ad managers.
- Reconcile offline conversions (calls, in-store visits) through CRM matching rather than assuming everything happens online.
Every attribution model carries a built in bias. Last-click inflates bottom-funnel channels like branded search and retargeting. First-click over credits top-funnel discovery. Data-driven or algorithmic models split the difference but are still opaque about how weights get assigned. The 2025 meta-analysis of advertising effectiveness found that once selection and publication biases are corrected, MMM estimates converge much closer to what randomized experiments show, which is a strong argument for validating any attribution model against a real holdout test rather than trusting it blind.
Pro Tip: Run a quarterly incrementality test even if your attribution setup looks clean. Platform-reported conversions almost always overstate incremental impact, and the only way to know your real number is to hold out a segment and measure the gap.
Why Test Design Beats Attribution Guesswork
Correlation between ad spend and sales is easy to find and usually wrong. Testing proves causation, which is the only thing that should drive budget decisions.
- A/B tests split audiences randomly between two creative or targeting variants and compare outcomes directly.
- Multivariate tests vary several elements at once, useful when you have enough volume to isolate interaction effects.
- Geo or time-based holdouts withhold ads from a region or period entirely, then compare against a matched control, the closest thing to a lab experiment most marketers can run.
Sample size determines whether any of this means anything. The 2025 elasticity meta-analysis estimates realistic short-term advertising elasticity at just 0.0008, meaning the true sales lift from typical spend increases is far smaller than most marketers assume, so detecting it reliably usually requires a large holdout or a longer test window than teams expect. Peeking at results daily and stopping the moment you see a good number is the single fastest way to fool yourself; pre-commit to a sample size and a stop date before launch.
Pro Tip: If your expected lift is under a few percentage points, a two-week A/B test probably won’t have the power to detect it. Budget for either a much longer test or switch to MMM for that specific question.
How Do You Build a Cross-Channel Ad Reporting Dashboard?
Every platform reports its own version of the truth, and none of them agree on what counts as a conversion. Consolidation means pulling spend, conversions, and a blended ROAS into one view, then deduplicating conversions that multiple platforms are independently claiming credit for.
- Cap the dashboard at 6 to 8 KPIs, more than that and nobody looks at it consistently.
- Pick one decision metric per view (ROAS for a performance campaign, reach for an awareness push) instead of forcing every stakeholder to scan the same wall of numbers.
- Filter by campaign objective and time window rather than mixing prospecting and retargeting data into a single blended rate that hides both.
- Annotate anomalous days, an outage, a holiday, a pricing change, so a future reviewer doesn’t misread a data glitch as a performance shift.
Klipfolio’s guidance on tracking digital ad campaigns stresses annotating attribution assumptions directly on the report, since a number without its methodology attached gets misread the moment it’s shared outside the team that built it. Choose your time window deliberately too: a 7-day view smooths daily noise but hides slow trends, while a 90-day view is stable but reacts too slowly to catch a creative that just started failing.
Turning Ad Performance Data Into Optimization Decisions
Data sitting in a dashboard changes nothing. The workflow that actually moves results runs in a fixed sequence every reporting cycle.
- Verify data first, confirm tracking fired correctly and spend numbers match the ad platform before you trust anything downstream.
- Segment results by audience, creative, and placement instead of judging a whole campaign as one blended average.
- Diagnose the cause behind any change, a CTR drop could be creative fatigue, audience saturation, or a new competitor bidding up the auction.
- Prioritize fixes using impact times confidence divided by effort, a low-effort bid adjustment with high confidence beats a full creative overhaul you’re only half sure will work.
- Test the fix before rolling it out account-wide.
- Measure the result against the same window and segment you diagnosed, then repeat.
A campaign with rising frequency and falling CTR usually means creative fatigue, the fix is new creative, not a bigger budget. A campaign with strong CTR but weak conversion rate usually points to the landing page, not the ad; that’s worth checking against technical performance benchmarks for landing pages before you blame the media buy. A campaign with strong ROAS at low spend but declining ROAS as budget scales has hit audience saturation, the fix is expanding targeting, not just raising bids.
Pro Tip: Keep a running log of every test you run, win or lose. Teams that skip this end up re-testing the same failed idea every six months because nobody remembers it already failed.
How Automation Speeds Up Reliable Ad Performance Analysis
Most of the time an analyst loses each week doesn’t go to insight, it goes to plumbing: manually joining exports from four ad platforms, renaming mismatched columns so a “Conversions” field in one system matches a “Purchases” field in another, and rebuilding the same weekly report from scratch because the last version broke when a naming convention changed.
- Manual cross-platform joins introduce copy-paste errors that quietly corrupt blended ROAS calculations.
- Naming mismatches between platforms (spend vs. cost, conversions vs. results) create silent double-counting in dashboards.
- Recurring report builds eat hours that should go toward diagnosis and testing, not data assembly.
A platform exists that connects AI agents or workflows to hundreds of marketing intelligence tools through a single connector, generating real-time analytics reports across SEO, ad performance, and competitor tracking without separately configuring each source. If you want to try it without overhauling your entire reporting stack, start small: automate one weekly consolidated report and run a manual dedupe check against it for the first month before trusting it fully.
How Clean Does Your Ad Data Need to Be Before You Trust It?
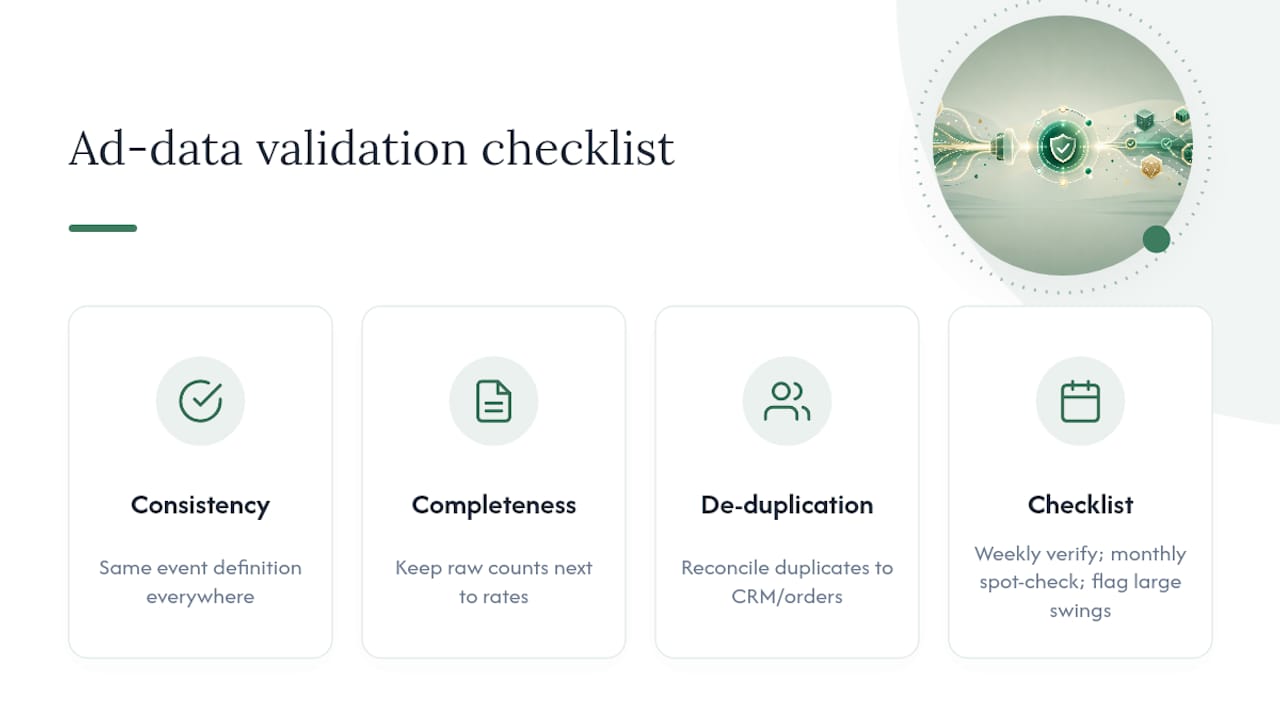
Bad data produces confident, wrong conclusions faster than no data does, which is the real danger. Before any metric goes into a report, it needs three checks: consistency, completeness, and de-duplication.
Consistency means the same event is defined the same way everywhere it appears. If “conversion” includes a newsletter signup on one platform and only a purchase on another, your blended conversion rate is comparing two different things wearing the same label.
Completeness means checking for tracking gaps before trusting a trend line. A sudden dip in conversions is often a broken pixel or an expired API token, not a real performance drop, and the fastest way to catch this is to keep a raw event count alongside your calculated rates so a break in one becomes obvious against the other.
De-duplication matters most in cross-channel reporting, where a single customer clicking a Google ad and later a Facebook retargeting ad can get counted as two separate conversions by two separate platforms. Reconciling this against a single source of truth, usually your CRM or order system, is the only way to get an honest blended ROAS instead of one inflated by double-counted revenue.
Build a standing checklist: verify event firing weekly, spot-check raw exports against platform dashboards monthly, and flag any day where spend or conversions move more than a set threshold from the trailing average for manual review before it enters a report.
How Much Should Statistical Noise Change Your Read on a Campaign?
On a sample of 300 clicks, it’s usually just noise. Ad data is noisier than most dashboards let on, because daily and weekly fluctuations in audience composition, auction competition, and even day-of-week behavior swamp small real changes.
The practical fix is treating any metric built on a small sample with real skepticism. Conversion rate on 20 conversions has enormous variance, a single unusual customer can swing it several points in either direction. The 2025 meta-analysis correcting for publication bias found real short-term advertising elasticity is far smaller than older studies claimed, largely because those older studies were built on smaller, cherry-picked samples that overstated effects. That’s the same trap a marketer falls into scanning a dashboard for a good week and calling it a trend.
Before declaring a change significant, check whether the sample size supports it. As a rough rule, don’t trust a rate built on fewer than 100 events, and be wary of any test result you’re evaluating before it’s run its full planned duration. Peeking early and stopping on a good day is how teams convince themselves a losing test won.
What Advanced Analytics Techniques Reveal That Basic Metrics Miss
Basic metrics tell you what happened. Regression analysis and anomaly detection start telling you why, and what’s likely to happen next.
Regression analysis lets you isolate which variables actually drive conversions when several are moving at once, spend, creative changes, seasonality, and competitor activity, rather than crediting the whole outcome to whichever lever you happened to pull most recently. A marketer running regression against weekly spend and conversion data might discover that a third of what looked like a spend-driven lift was actually a seasonal pattern repeating from the year before.
Anomaly detection flags days or segments that deviate from expected patterns automatically, catching a tracking break or a sudden cost spike before it quietly corrupts a month of reporting. This matters more than it sounds, because the alternative is a human noticing a strange number weeks later while building a quarterly report, long after the budget has already been misallocated based on bad data.
Neither technique requires a data science team to start using. A simple moving-average band around your key metrics, flagging anything outside two standard deviations, catches most real anomalies with basic spreadsheet functions. Regression gets more value from a dedicated analytics tool, but even a rough correlation matrix across your core variables often reveals which one actually matters before you build anything more complex.
What Biases Distort Ad Performance Reports Most Often?
The most dangerous bias in ad reporting is survivorship: judging a campaign’s success only by the customers who converted, while ignoring what happened to everyone who saw the ad and didn’t. This inflates perceived effectiveness because you’re never comparing against a true baseline of what would have happened anyway.
Selection bias shows up when retargeting gets credited for conversions from people who were already likely to buy. Someone who abandoned a cart was closer to purchasing before they ever saw the retargeting ad, yet the platform claims full credit for the sale.
Confirmation bias shows up when a marketer already believes a campaign is working and unconsciously picks the metric that confirms it, citing CTR when conversion rate is weak, or citing reach when both are weak.
Platform self-attribution bias is structural: every ad platform’s dashboard is incentivized to overstate its own contribution, since more perceived value justifies more budget. This is precisely why the IAB Europe framework pushes for independent, harmonized measurement rather than trusting any single platform’s self-reported numbers at face value.
The fix for all three is the same: hold out a control group, run a real incrementality test periodically, and treat any platform’s claimed conversions as a starting hypothesis, not a verified fact.
Practical Habits That Turn Dashboards Into Decisions
Daily reviews should stay narrow: check for tracking breaks, spend pacing, and anything wildly off pattern. Save diagnosis for weekly reviews, where segment-level trends actually have enough data to mean something.
Keep an experiment registry so nobody re-runs a test that already failed. Annotate every anomaly the day it happens, not weeks later from memory. Most of all, insist on one source of truth for conversions, every argument about “which number is right” traces back to teams trusting different systems.
— Sergey
Get Consolidated Ad Reporting Without the Manual Spreadsheet Work
Prowl exists for the exact bottleneck this guide keeps circling back to: the hours lost joining exports, renaming mismatched fields, and rebuilding the same weekly report by hand. Instead of configuring separate tools for SEO tracking, competitor analysis, and ad performance, Prowl connects any AI agent to 444 market-intelligence tools through one Market Intelligence Connector, generating consolidated reports on demand.

For a marketing team, that means the media, brand, and sales layers this article walks through can pull into a single automated output instead of three separate manual exports. Agencies and analysts running frequent competitor or ad performance reports get the most out of it, since the use cases built around analytics and reporting workflows map directly onto the reporting cadence most teams already run weekly. Teams already working inside Cursor can connect Prowl directly as an MCP server for live market data without leaving their existing workflow.
Start with the getting started guide and automate one report this week, the same weekly consolidated view this guide recommends testing before wider rollout.
Sources
The 2025 IJRM meta-analysis on advertising effectiveness grounds realistic elasticity expectations and explains when MMM estimates converge with experimental results. The IAB Europe Digital Advertising Effectiveness Framework supplies the media, brand, and sales structure this entire playbook is built around. AppsFlyer’s metrics guide offers the practical formulas and dashboard discipline behind the core metrics sections, and understanding ROAS thresholds helps translate raw ratios into profitability calls.
- Meta-analysis of advertising effectiveness with bias corrections (IJRM 2025)
- Understanding ad metrics — AppsFlyer (measurement & analytics guide)