
Win loss analysis is the practice of finding out why you win or lose deals by asking the people who made the decision, then checking what they say against your own pipeline data. Done well, it replaces the stories your team tells itself about closed deals with patterns you can act on. This guide covers which deals to study, how to interview buyers, how to code and segment what you hear, how to read a win-loss ratio, and how to turn it into a program that runs every quarter.
TL;DR
- Win loss analysis combines buyer feedback (interviews, surveys) with CRM and market data to explain why opportunities close or stall.
- Start with a small, well-chosen set of recent deals, especially late-stage losses and the wins that were close, and use a neutral interviewer.
- Tag every answer into consistent categories and segment by competitor, deal size and persona, so one loud story does not drive strategy.
- A win-loss ratio of 2.0 means two wins for every loss, which is a win rate of about 67%. Define your denominator before you compare numbers.
- The program only pays off when findings reach product, sales and marketing on a fixed schedule.
Table of Contents
- What win loss analysis actually is
- Which deals to include, and when
- Step by step: running the analysis
- Coding, segmenting and verifying what you hear
- How to read a win-loss ratio
- Turning findings into a repeatable program
- Where win loss analysis goes wrong
- Our perspective
- Put market evidence behind your buyer interviews
- FAQ
- Sources
What win loss analysis actually is
At its core, win loss analysis is an assessment of customers’ experiences with your product, marketing and sales process, aimed at explaining why they did or did not buy. The key word is customers’. Your CRM records what a rep believed happened. The buyer knows what actually happened.
That difference has been understood for a long time. A Financial Times Press chapter on the subject describes it as direct feedback from a client or prospect about why a specific sale or contract was won or lost, and notes that aggregating those interviews shows how buyers saw you relative to your competitors. A single interview is an anecdote. Twenty interviews, coded the same way, are evidence.
Forrester’s 2025 research frames a mature program as one that tracks win and loss rates, analyzes why the organization wins and loses, and uses direct buyer feedback to find strengths and weaknesses in the offering, the selling, the marketing or the company itself. Notice the range: the answer might be product, price, positioning, a slow procurement experience or a champion who left. Win loss analysis is not a sales postmortem. It is a company-wide diagnostic.
What it can reveal that your CRM cannot
- The real trigger. What event made the buyer start looking: a missed quarter, a new executive, a failing incumbent?
- The hidden buying journey. Steps, committees and approvals your reps never saw.
- Who really decided. The economic buyer, the technical gatekeeper and the quiet influencer are often different people.
- Which criteria carried weight. Buyers rank criteria differently than sellers assume. Integrations you consider a footnote may have decided the deal.
- How you were perceived. Not what your deck says, but what the buyer remembered after three vendor demos.
Which deals to include, and when
The most common mistake is trying to study everything. Win loss work is slow, and interviews are the bottleneck. Choose deliberately.
Study recent decisions. Memory fades quickly, and buyers who closed a purchase months ago remember the outcome but not the reasoning. Aim to talk to buyers soon after the decision, while the evaluation is still vivid. Set a rule such as “interview within a quarter of the close date” and hold to it.
Prioritize by learning value, not volume. If your resources are limited, start with:
- Late-stage losses, where you were one of the final two or three vendors. These teach you the most about positioning and price.
- Wins that were close. They show what actually tipped the decision, and what could have gone the other way.
- Losses to “no decision.” These are often the largest category and the least examined. Buyers who did nothing are telling you the problem was not urgent enough, or that your case for change was weak.
- A few easy wins, to learn what is working so you can protect it.
Early-stage disqualifications are usually better handled by lead-quality analysis than by interviews.
How many interviews do you need?
There is no magic number, but a pattern should never rest on one conversation. As a working rule, we would want several interviews in each segment you plan to draw conclusions about before presenting it as a finding. If you only have four losses against one competitor, say so and label the finding as a hypothesis to test.
Step by step: running the analysis
1. Set the questions before you pick the deals
Write down two or three decisions the research must inform. Examples: “Should we change our packaging for mid-market buyers?” or “Why are we losing to a lower-priced alternative in healthcare?” A program without a question produces a slide deck nobody uses. Get a sponsor in product, sales or marketing who has the authority to act on the results.
2. Build the deal list from your CRM
Export closed opportunities for the period and add the fields you will need later to segment: competitor named, deal size, industry, persona, lead source, pipeline stage reached, sales rep, region. If your CRM does not capture the competitor consistently, fix that first. It is the single most useful field in the dataset.
3. Use a neutral interviewer
Buyers are polite to the salesperson who sold to them and sometimes candid with a stranger. Reps also unconsciously defend decisions. Outsourcing to an independent party is one option; another is an internal person with no stake in the deal, such as a product marketer or researcher. Never let the account executive or their manager run the call.
4. Ask open, non-leading questions
One-to-one interviews give depth. Short surveys give breadth. Use interviews for your priority deals and surveys for the long tail. Keep the conversation short enough that a busy buyer will agree to it.
Questions that work:
- What was happening in your business that made you start looking?
- Who was involved in the decision, and what did each person care about?
- Which vendors did you consider, and how did you find them?
- What mattered most in the final decision? What nearly changed your mind?
- How did our team compare in the sales process, not just the product?
- If you could change one thing about how we presented our solution, what would it be?
Questions to avoid: anything beginning “Don’t you think…” or “Was it because of price?” The second one hands the buyer an easy, face-saving answer. Let them volunteer it.
5. Capture the data in a consistent structure
Use the same template for every interview, whoever conducts it. Record the deal facts first, then the buyer’s own words, then your interpretation. Keep these three separate. A tidy summary that blends them makes it impossible to audit later.
Coding, segmenting and verifying what you hear
Raw interview notes are not insight. The work that turns them into insight is coding. Tagging qualitative data into consistent categories, such as sales performance, product feedback and competitive intelligence, lets you see trends instead of relying on single stories. The same source makes a useful point about cohorts: trend analysis requires grouping interviews by shared characteristics, otherwise your findings are one-off stories.
A practical coding frame:
| Category | Example tags | Typical owner |
|---|---|---|
| Product | Missing integration, usability, reporting depth | Product |
| Pricing and packaging | Total cost, contract terms, unclear tiers | Product, finance |
| Sales experience | Responsiveness, discovery quality, demo relevance | Sales leadership |
| Positioning and brand | Not seen as credible, unclear differentiation | Marketing |
| Competitive | Named alternative, perceived advantage | Competitive intelligence |
| Buying process | No budget, no urgency, internal champion left | Sales, marketing |
For teams who want a deeper treatment of how customer feedback feeds growth decisions, this piece on customer feedback and revenue growth is a good companion when you start building your tagging system.
Segment before you conclude
A 40% win rate across the company can hide a 70% rate in one segment and 15% in another. Slice the coded data by:
- competitor
- buyer persona
- deal size band
- industry
- lead source
- pipeline stage where the deal ended
Then apply a simple rule: do not act on a pattern until it shows up in at least two independent places. For instance, buyer interviews and your CRM loss reasons both point to a missing integration. Or interviews and a competitor’s recent pricing change both explain a run of losses. Corroboration is what separates a finding from a hunch.
Bring in outside data to test the story
Buyer feedback tells you how decision-makers perceived you. It does not tell you what the market was doing around them. That is where external data earns its place. If buyers say a rival was “cheaper,” check the rival’s actual price moves. If they say a competitor “seemed more credible,” look at their review profile, ad spend and search visibility over the same period. Our guides on competitive pricing analysis and automated competitor analysis walk through how to do this without spending days in spreadsheets.
Funnel data helps too. If losses cluster at one stage, an automated funnel analysis can show whether the leak is a conversion problem or a qualification problem, which changes who should own the fix.
How to read a win-loss ratio

Two of the most common questions about win loss analysis are about the number itself: how do I interpret a win-loss ratio, and what does 2.0 mean?
The ratio is simple arithmetic: wins divided by losses.
| Wins | Losses | Win-loss ratio | Win rate (wins ÷ wins + losses) |
|---|---|---|---|
| 10 | 10 | 1.0 | 50% |
| 20 | 10 | 2.0 | 67% |
| 15 | 30 | 0.5 | 33% |
| 30 | 10 | 3.0 | 75% |
So a ratio of 2.0 means you win two deals for every one you lose. A ratio of 1.0 is break-even, and anything below 1.0 means you lose more than you win. Win rate is a related but different figure, and mixing the two is a common source of confusion in meetings.
What the ratio does not tell you:
- What counts as a loss. Do “no decision” outcomes count? Do deals disqualified early? Two companies with the same ratio may be measuring different things. Write your definition down and keep it fixed.
- Whether it is good. A 2.0 ratio in a competitive enterprise market may be excellent. In a market where you are the only credible vendor for your inbound leads, it may be weak. Benchmark against your own history and your own segments first.
- Why it moved. A ratio is a thermometer. It says you have a temperature, not what is causing it. That is exactly the gap win loss analysis fills.
Track the ratio by segment and by quarter, and read it alongside average deal size. A rising ratio with falling deal value can mean you are winning small deals and losing big ones.
Turning findings into a repeatable program
One analysis is a project. A win loss program is a habit. Forrester’s view is that the work is valuable when it moves from measurement into action, with buyer evidence driving product, go-to-market, productivity and profitability improvements. A few mechanics make that happen.
Fix a cadence. Quarterly readouts work for most teams. Monthly flash updates on notable losses keep the topic alive between them.
Assign owners to findings. Every recommendation needs a name and a date. “Marketing should clarify positioning” is not an action. “Product marketing rewrites the mid-market comparison page by the end of next quarter” is.
Share broadly. Findings should inform product roadmaps, sales training and messaging. Send a one-page summary to each function, written in that function’s language, rather than one deck for all.
Close the loop with the sales team. Reps who feel the program is surveillance will resist it. Show them where the insights helped them win, and give them credit for deals where their process was praised.
Feed marketing directly. When buyers say what convinced them, that language belongs in your messaging. Teams that want to test and refine that language against real conversion outcomes can look at tools such as copy optimization based on conversion data to put buyer wording into ads, emails and landing pages.

Measure the program itself. Track the number of interviews completed, time from close to interview, share of findings that led to a change, and movement in win rate for segments where you acted.
Where win loss analysis goes wrong
- Only studying losses. You learn why you fail but not what to protect.
- Letting the loudest story win. A vivid loss with a senior executive attached can skew priorities. Count it, but weigh it against the pattern.
- Leading the witness. If the interviewer is hoping to hear “price,” they will find it.
- Waiting too long. The longer the gap, the more buyers reconstruct a tidy rationale rather than recall the real one.
- Never connecting it to market data. Buyer perception is one input. Competitive moves, pricing shifts and category trends are another.
- Producing a report, not a decision. If nobody changed anything, the program did not work, however good the slides.
Our perspective
We see the same pattern in almost every team that tries win loss analysis for the first time. The interviews are rich, the quotes are vivid, and then the program stalls because the next step, checking the story against the market, takes too long to do by hand.
Buyer feedback is the heart of the method, and nothing replaces it. But a buyer who says “your competitor looked stronger” is giving you a perception. Whether that perception matched reality depends on pricing, reviews, advertising, search presence, funnel behavior and category trends, none of which live in your CRM. Pulling those together from separate tools is where analysts lose days.
That is why we built Prowl around a single connection that gives an AI agent or workflow access to 444 market-intelligence tools. Our approach is designed so that an agent can cross-reference several providers in one workflow, produce a synthesized report, and keep every number traceable to its source, with coverage gaps stated openly rather than hidden. For win loss work, that means you can take the competitor a buyer named and test the story in the same session: pricing moves, ad activity, review themes, search visibility.
We think the best win loss programs pair what buyers say with what the market shows, and treat unverified claims, from a buyer or from a tool, with the same skepticism.
Prowl Team
Put market evidence behind your buyer interviews
Once your interviews are coded, the next question is what the market data says about the same deals. Prowl connects your agent or workflow to 444 marketing-intelligence tools through one endpoint, so you can check a competitor’s pricing, advertising, reviews and search presence against what buyers told you, and get the result as an interactive report, PDF or slide deck.
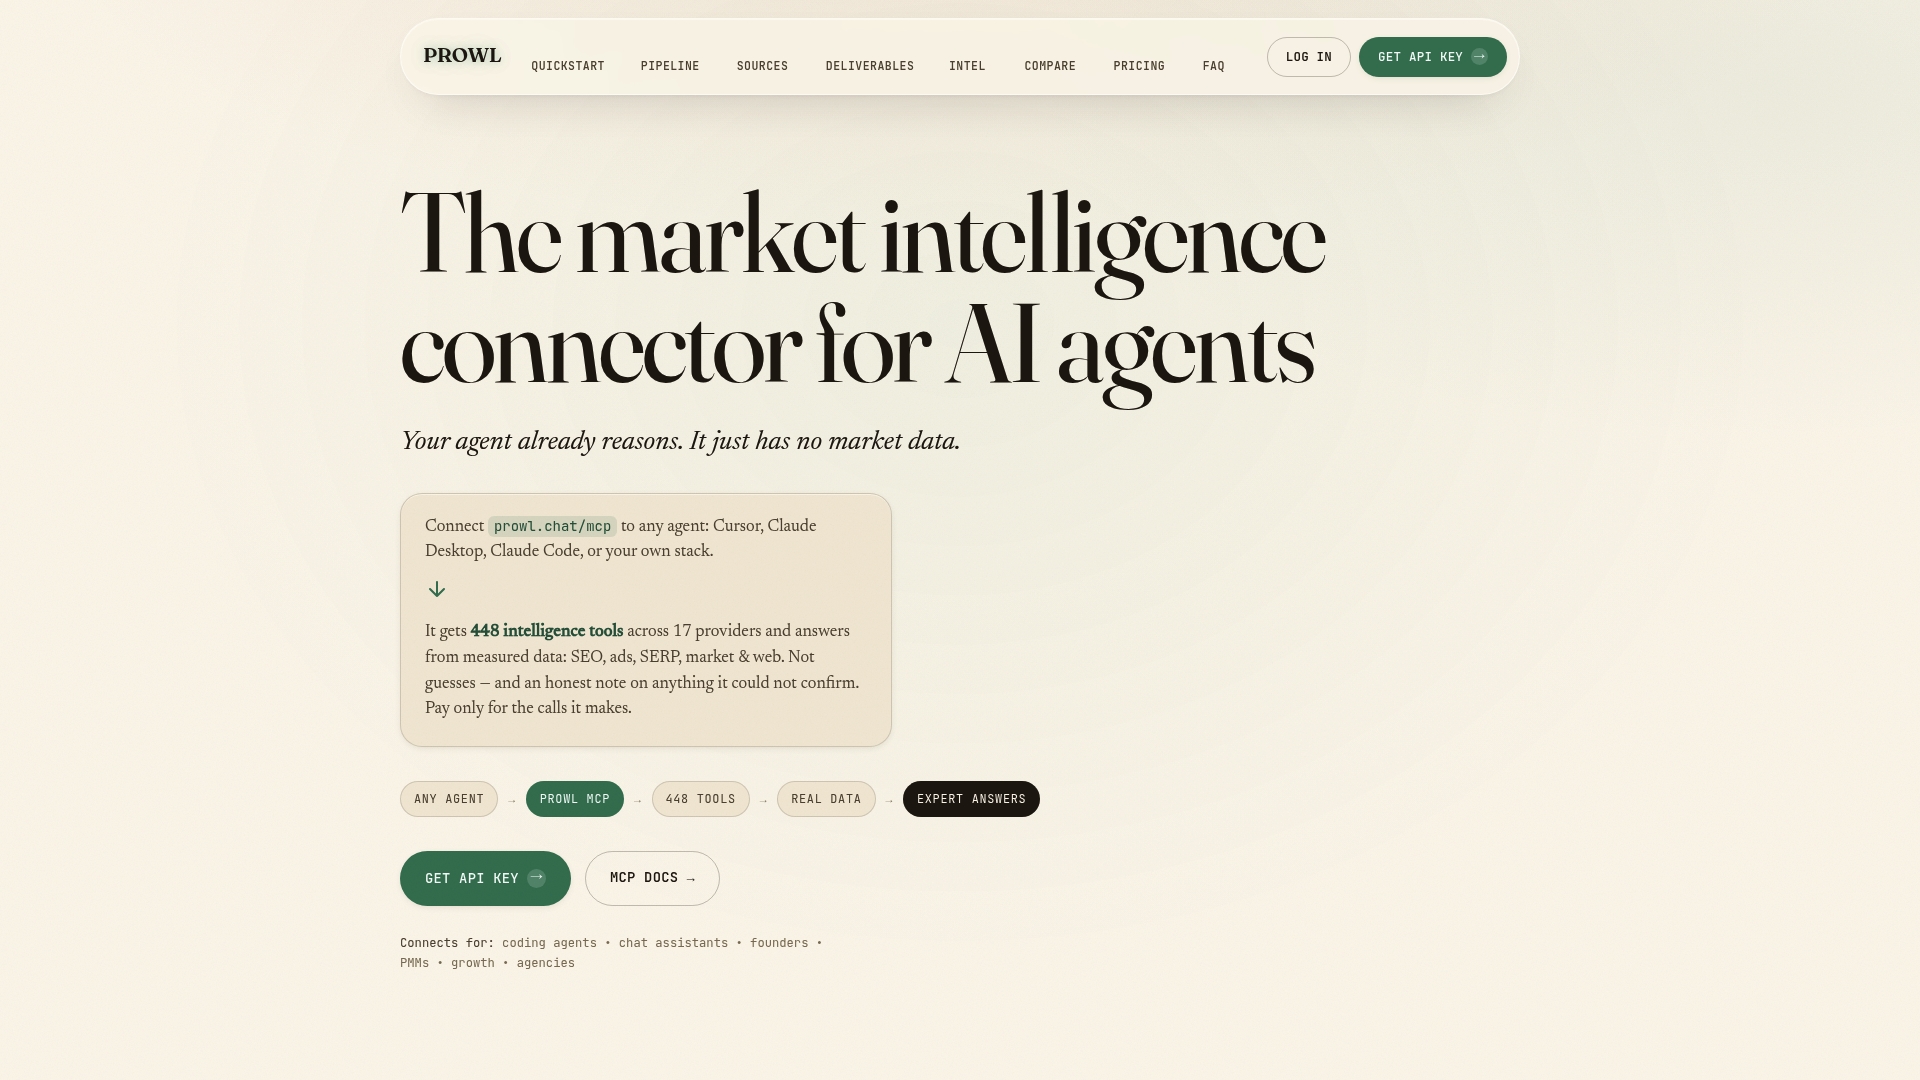
Plans on the pricing page include Exploit at $60 per month, Blackops at $120 per month and Syndicate at $240 per month. If you would rather pay as you go, prepaid credits come in $10, $50 and $200 amounts. You can also see how teams use it on the use cases page or start at prowl.chat.
FAQ
What is the difference between win loss analysis, a win loss program and win loss research?
They describe the same discipline at different scales. Win loss research is the act of gathering buyer feedback, win loss analysis is the interpretation of it, and a win loss program is the ongoing, scheduled version with owners, a cadence and reporting. Most teams begin with a single analysis and grow it into a program once the first findings lead to visible changes.
How many deals should I analyze to start?
Start small and prioritize quality over quantity. Pick a handful of recent, late-stage losses and close wins within a single segment, interview the buyers, and look for repeated themes. Treat anything that appears in only one or two conversations as a hypothesis, and expand the sample before changing strategy.
What does a 2.0 win-loss ratio mean?
It means you win two deals for every one you lose, which equals a win rate of about 67% when only wins and losses are counted. Whether that is strong depends on your market, segment and how you define a loss, so compare it with your own earlier periods before judging it.
Who should conduct win loss interviews?
Someone with no stake in the deal. An independent third party is the cleanest option, and an internal researcher or product marketer is a reasonable alternative. Avoid the salesperson or their manager, since buyers soften their answers and interviewers tend to defend the original process.
Can I use survey data instead of interviews?
Surveys are useful for broader coverage and for tracking trends over time, but they rarely capture the reasoning behind a decision. The usual approach is to use interviews for your most important deals and short surveys for the rest, then code both with the same categories so the results can be combined.
Sources
- The Ultimate Guide to Win/Loss Analysis, Pragmatic Institute
- Comprehensive Approach to Win/Loss Analysis, Pragmatic Institute
- Win-loss analysis chapter, Financial Times Press
- Uncovering The Reasons For Wins And Losses, Forrester
- Customer feedback and revenue growth
- Coppica copy optimization