
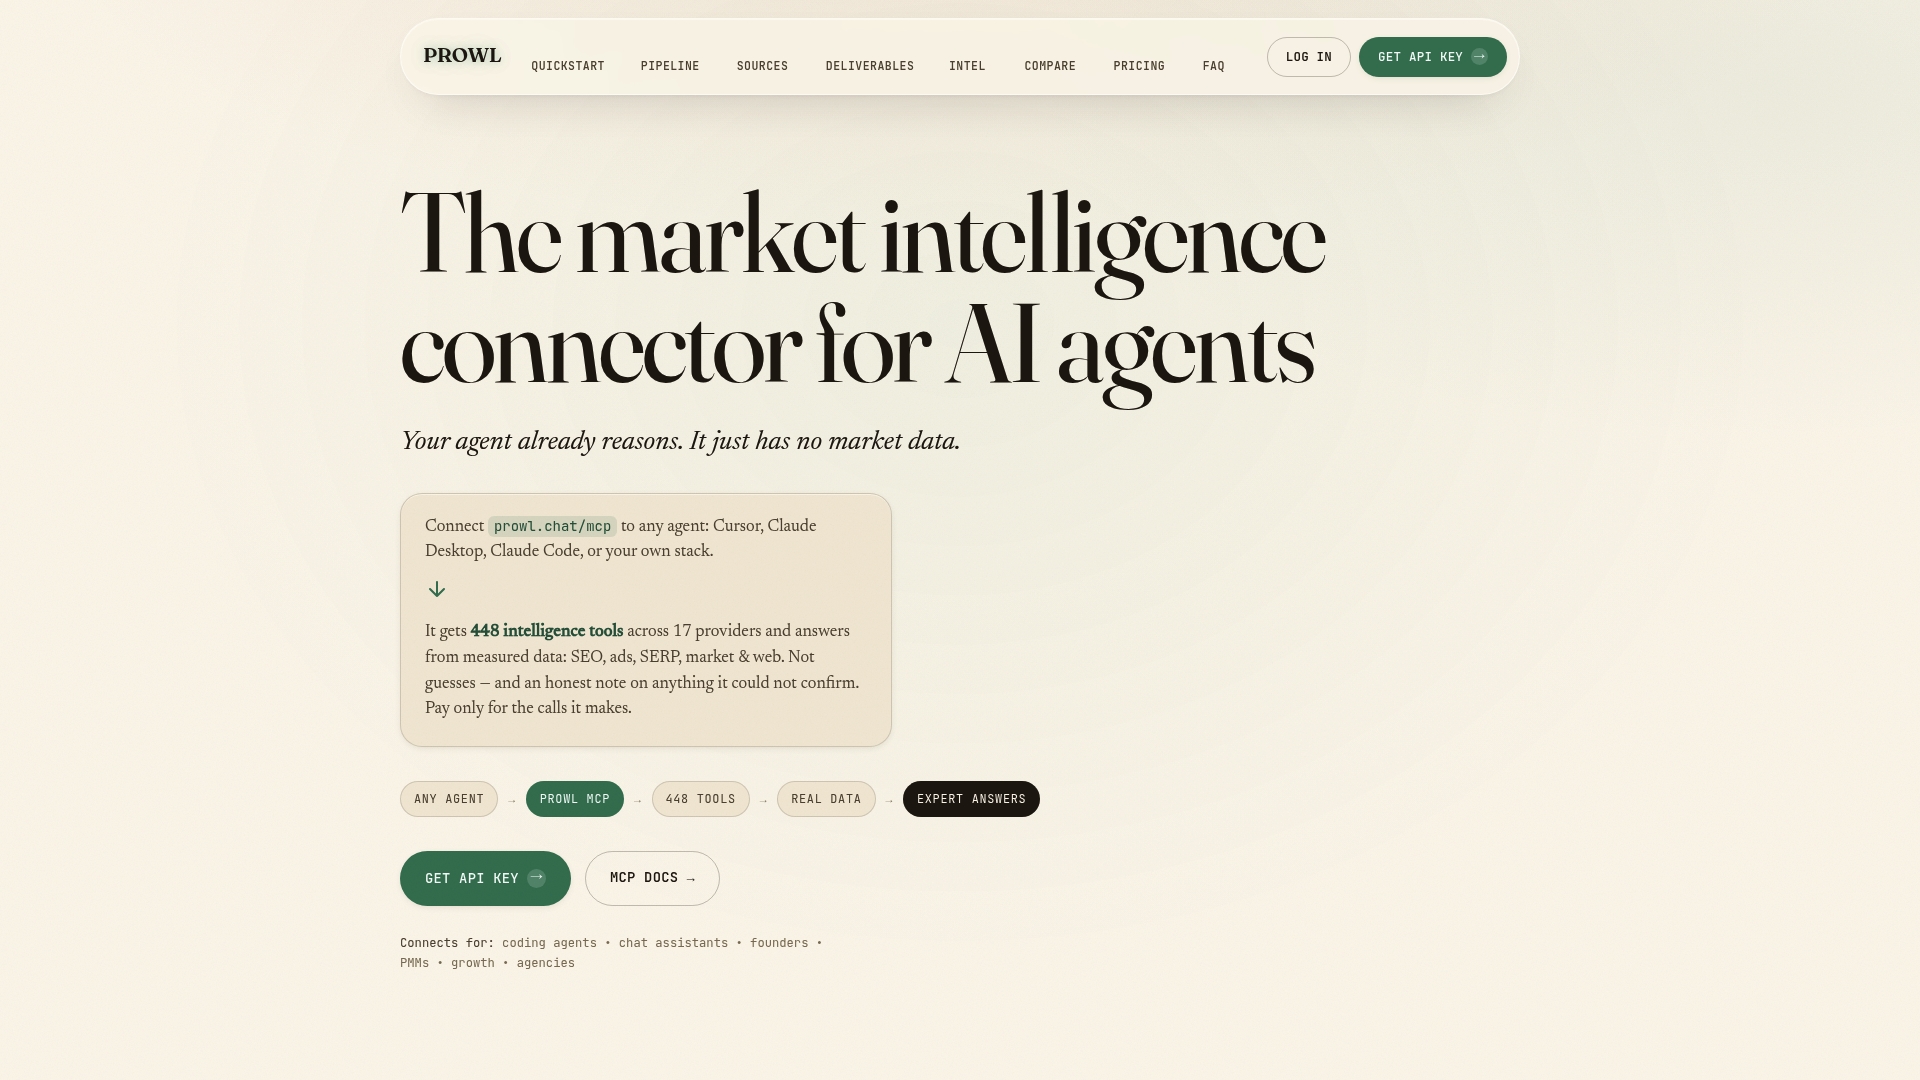
A social listening API lets software pull public mentions, posts, comments and reviews into your own reports, instead of someone watching a dashboard. The catch is that no single social API sees everything, so the useful question is not “which API has the most data” but “which conversations will my system never see, and how do I close that gap?” For teams that want brand mentions, reviews and market signals in one workflow, the answer is a single connection that reaches many sources, which is how Prowl is built: one API that gives your agent access to 442 marketing intelligence tools.
TL;DR
- A social listening API returns mentions and conversations as data. A monitoring API or social data API is largely the same idea, but an analytics-only API may give you counts without the underlying posts.
- Every platform sets its own rules, prices and quotas. Plan around those limits before you design the report.
- Review data (app stores, review sites) is often more reliable for product decisions than open social chatter, and it needs its own sentiment step.
- The hard part is not fetching data. It is cross-referencing sources and keeping every number traceable.
- One connection to many tools beats building and maintaining one integration per platform.
Table of Contents
- What a social listening API actually is
- What each platform lets you see
- Coverage is the metric that matters
- Tracking brand mentions in practice
- Review data: the quieter, more reliable signal
- Making the data usable: integration without the sprawl
- Who gets the most from a connected approach
- Prowl pricing for listening and reporting work
- Our perspective
- FAQ
- Sources
What a social listening API actually is
Three phrases circulate for roughly the same thing: social listening API, social monitoring API and social data API. All three return conversation data programmatically so you can track brand mentions, measure sentiment and watch competitors without logging in to each network.
The differences that matter are in what comes back:
- Raw content APIs return the posts, comments or reviews themselves, with author, date and engagement fields. You can run your own analysis on them.
- Aggregate analytics APIs return counts, reach and trends. They are fine for charts, but you cannot check why a number moved.
- Account-bound APIs return only activity on accounts you own or are authorized to manage, such as your inbox or your own posts. They are not a way to hear what the market says about you.
That last distinction trips up many teams. An API that publishes posts or manages your messages is not a listening API, however much social data it touches. Before you commit, ask one plain question: can I get the underlying mentions of a brand I do not own, or only my own account activity?
What each platform lets you see
There is no universal feed. Each network decides who may read what, and the rules changed a lot in recent years.
According to a July 2026 guide to building a listening agent, X moved its API to pay-per-use pricing in February 2026, at $0.005 per post read. The same guide reports that Reddit’s Data API is free only for non-commercial use, capped at 100 queries per minute per OAuth client ID, and that TikTok’s Research API is limited to qualifying academic institutions and non-profit research bodies, with a quota of 1,000 requests per day.
For a commercial team, that has practical consequences:
| Platform | What you can typically expect | Planning implication |
|---|---|---|
| X | Public search and streams, billed per post read | Cost scales with volume, so budget per query |
| Free tier is non-commercial only | A commercial use case needs commercial terms | |
| TikTok | Research access is restricted to qualifying institutions | Brand monitoring needs another route |
| Instagram and LinkedIn | Focus on authorized account activity | Competitor and market listening is limited |
| YouTube | Search and comments | Good for video reactions, not full-network coverage |
Treat this table as a starting point and check each platform’s current terms before building, because prices and access tiers change.
Regulation is changing access too
In the EU, the Digital Services Act requires very large online platforms to give researchers access to publicly accessible data, including real-time data where technically possible. This is described in an academic paper on regulated data access, which also notes that researchers have repeatedly flagged data quality problems with the TikTok API. The takeaway for a business team: access routes built for researchers do not automatically serve commercial brand tracking, and what a platform returns is not guaranteed to be complete or clean.

Coverage is the metric that matters
Most buyers compare tools on sentiment accuracy. A better first question is coverage: which sources does the system reach, and which does it not?
If your report says “sentiment is 72% positive” and it only saw one network plus a handful of review sites, the number is accurate about a slice and silent about the rest. A report you can defend states what it covered, what it could not see and why.
A practical coverage checklist for any listening setup:
- List the places your customers talk. Social networks, forums, app stores, review sites, search results.
- Mark which of those you can legally and technically read. Public and commercial-use terms differ.
- Record the gaps in the report itself. A visible gap is better than a hidden one.
- Decide how fresh data must be. Daily is fine for trend reports, while a crisis needs near real time.
- Keep the source link for every number. If a stakeholder asks where a figure came from, you can show them.
A web data API evaluation checklist is a useful way to pressure-test the reliability and completeness of whatever data you collect before it reaches a report.
Tracking brand mentions in practice
The common brief is simple: tell me when and where people mention my brand, and whether the tone is changing.
A workable routine looks like this:
- Define the query set. Brand name, product names, common misspellings, founder names and competitor names for comparison.
- Pull from several source types. Social posts, review sites, search results and app store reviews each show a different side of the same story.
- Deduplicate. The same story gets reposted and quoted. Count it once or flag it as a cascade.
- Classify. Tag by topic (pricing, bugs, support) before you tag by sentiment. Topics tell you what to fix.
- Compare over time. A week-on-week change with a named cause is a finding. A single snapshot is not.
- Report with sources. Each claim links back to the mention that produced it.
Steps 2 and 6 are where in-house builds usually stall. Each source needs its own authentication, rate-limit handling and field mapping, and the final report needs a consistent way to point back to where every figure originated. With Prowl, your agent or workflow connects once and reaches the tools through one API, so you spend the effort on the questions, not on the plumbing. Prowl is designed so that every number in a deep report is traceable back to its source.
Review data: the quieter, more reliable signal
Social chatter is noisy. Reviews are structured: a rating, a date, a text body, often a product version. That makes them excellent for product managers validating what to build next.
What the structured fields allow:
- Rating distribution by version, so you can see whether a release helped or hurt.
- Topic tags over time, such as crashes, pricing complaints or UX friction, compared period against period.
- Cross-tabulation by country or platform, which turns a flat pile of reviews into something you can slice.
- Competitor comparison, where you set your complaint profile against a direct competitor’s reviews to find weaknesses they have not addressed.
One detail often surprises teams: many review endpoints return ratings and text but no sentiment label, so sentiment has to be derived in a separate step. Plan that step on purpose. If you want a worked pipeline for it, see our review sentiment analysis guide and the wider sentiment analysis techniques collection. For app store rankings and reviews delivered to an agent, the App Store data MCP page shows how it works.
Worked example: a release goes badly
Imagine a product team ships version 2.3 of a mobile app. Within two weeks, the average rating drops from 4.5 to 4.1. A raw rating chart tells you something is wrong. It does not tell you what.
So the team does this:
- Split reviews into before and after the release.
- Tag the after-release reviews by topic.
- Find that one topic, say sign-in failures, accounts for most of the new one-star reviews.
- Cross-check against social mentions and search results to see whether the issue is spreading beyond the store.
- Report the finding with links to the underlying reviews, so engineering can verify it.
The example is illustrative, not a real customer case, but the shape is the one a product manager uses every release cycle.
Making the data usable: integration without the sprawl
Teams integrate listening data in three common ways, and the difference is how much you maintain afterward.
- Per-platform integrations. You get full control, and you own every authentication flow, quota, schema change and policy update. With five sources, that is five maintenance streams.
- A policy layer in front. Many teams add a rules layer that encodes each platform’s permitted endpoints, caching duties and data minimization rules as configuration. It is sound practice, and it is more engineering.
- A single connector for agents. Your agent calls one endpoint and the data tools sit behind it.
The third path is where Prowl sits. Its positioning is a streamlined single-connector setup that replaces individual tool integrations and delivers cross-referenced multi-provider analytics in one workflow, so an agent can produce a synthesized report in minutes rather than hours. For the integration mechanics, our marketing API integration guide walks through a lean setup, and the pipeline and MCP sections of the site show how an agent connects.
Quality controls to build into any pipeline
Whatever route you choose, these habits keep the output trustworthy:
- Cache within each source’s rules, since some review platforms require refreshing stored data at least every 24 hours, per the aggregator guide above on platform quotas.
- Log which source and query produced each data point.
- Version your query definitions so a trend line does not shift because someone edited a keyword.
- Separate facts (counts, dates) from interpretation (sentiment, themes).
- State the coverage gaps in every report.
Who gets the most from a connected approach
- Marketing agencies serving many clients need repeatable reports across sources, and deliverables clients can open: Prowl outputs interactive reports, PDFs, infographics, PPTX, video and audio.
- Business analysts who need quick synthesis across sources without writing a connector for each.
- Product managers validating trends from reviews, search and competitor activity.
- Founders exploring a market before committing budget.
- Growth teams who want ad performance, SEO and funnel signals next to brand conversation.
The use cases page shows how these look in practice.
Prowl pricing for listening and reporting work
Prowl bills by metered usage through pre-paid credits, or by monthly subscription.
The subscription plans are Exploit at 60 USD per month, Blackops at 120 USD per month and Syndicate at 240 USD per month, alongside Recon. Credit top-ups come in $10, $50 and $200 amounts, one-off. Details for every plan are on the pricing page.
If you want to see what an agent can do with one connection to 442 tools, start with Prowl and choose the plan or credit amount that fits your reporting volume.
Our perspective
Most listening projects fail in the same place: not at the first data pull, but at the sixth source, when the team is maintaining connectors instead of answering questions.
We built Prowl on the opposite idea. One API, 442 tools, and an agent that can cross-reference sources inside a single workflow. A listening signal on its own is a hint. The same signal checked against reviews, search behavior, ad activity and pricing becomes evidence.
We also believe a report is only as good as its audit trail. Every number should lead back to where it came from, and coverage gaps should be stated openly, not buried. That is what lets a strategy rest on verified insight rather than assumption.
Prowl Team
FAQ
What is the difference between a social listening API and a social monitoring API?
In practice the terms overlap: both return mentions and conversations as data. The real difference is what comes back. Some APIs return the underlying posts and comments, while others return only aggregate counts, so confirm you get the content you need to verify a number.
Can I track brand mentions in real time?
Sometimes, depending on the platform. X offers public search and streams, billed per post read, while other networks limit access to authorized accounts or approved researchers. Real time is a coverage decision, so decide which sources need it and which can refresh daily.
How do I analyze app reviews at scale?
Pull the review text with its rating, date and version, then tag topics and derive sentiment in a separate step. Compare periods and app versions to see what changed after a release. Our App Store data MCP page covers rankings and reviews for agents.
Why do my sentiment numbers differ between tools?
Tools see different slices of the conversation and classify text differently. Compare coverage first, then definitions: which sources, which dates, which languages, and how neutral is handled. Keeping a source link for each figure makes differences easy to trace.
How much does it cost to run listening and reporting through Prowl?
Plans run from Exploit at 60 USD per month to Syndicate at 240 USD per month, with Blackops at 120 USD per month in between. You can also top up with one-off credits of $10, $50 or $200. See the pricing page for what each includes.
Sources
- Build a Social-Listening Agent for Brand Monitoring, 2026 guide
- Election research in the age of regulated data access under the Digital Services Act
- Web Data API Evaluation Checklist: 2026 Guide