
Market mapping analysis places the players in a market on a grid, usually two axes such as price and primary benefit, so you can see who competes with whom and where nobody is serving customers well. The map is only as good as the data behind it. Prowl connects an AI agent or workflow to 444 marketing intelligence tools through one API, so you can build the map from live SEO, ad, review, pricing and trend data in one pass, with each number traceable to its source.
This guide is for marketing agencies, analysts, product managers, founders and growth teams. It covers what a market map is, what real ones have revealed, how to build one step by step, and how to turn it into a landscape report that people act on.
TL;DR
- A market map positions competitors, segments or products on two or more dimensions, so gaps and crowded areas are visible at a glance.
- Define the decision the map supports and choose your axes before you collect any data. Scoping errors compound later.
- An empty corner is a hypothesis, not an opportunity. Check whether customers want that position and whether you could defend it.
- A competitive landscape report wraps the map in written analysis: clusters, white space, profiles and a recommendation.
- Maps go stale. Pull live data on a regular schedule instead of redrawing from memory each year.
Table of Contents
- What market mapping analysis is
- What real market maps have revealed
- How to build a market map, step by step
- Market map or competitive landscape report?
- Keeping the map current
- Promo: run your next market map through one connector
- Perspective
- FAQ
- Sources
What market mapping analysis is
A market map is a picture of a competitive field. Each competitor, product or segment is placed according to characteristics that matter to buyers. The two most common versions are a positioning grid (for example price against perceived quality) and a segment map (a market divided into the specific needs customers are trying to meet).
The analysis is what you do after the picture exists. Clusters show where price competition is likely to be fierce. Economics Online explains the logic: firms packed together sell close substitutes, which makes demand more sensitive to price, while a firm that differentiates in an underserved segment can aim for premium pricing.
The terms overlap in practice. A market map, a competitive landscape and a perceptual map each answer a slightly different question, and we separate them below. They share one habit: you decide what the reader of the map must conclude, and you choose the dimensions to serve that decision.
What real market maps have revealed
Examples are the fastest way to see what a map can do, and the best-documented ones come from consumer goods and brand strategy.
A dairy-beverage company found it was absent from most of its market. McKinsey describes a European consumer goods company whose dairy-beverage share was declining. It built a map from consumer purchase drivers, splitting the market into 20 micro-segments such as healthy and filling for breakfast, or tasty and portable with lunch. The map showed that the company had no presence in almost two-thirds of the attainable marketplace. Closing those gaps was projected to lift revenues by 8 to 14 percent over three to five years.
A breakfast maker prioritized by revenue potential. In the same McKinsey piece, a breakfast products maker used market maps to rank innovation opportunities. It doubled ad spend on its core brand, introduced snack-size options and replicated its on-the-go positioning across products. Sales of the brand rose 8 percent within a year.
White Claw’s real rival was a beer brand. Harvard Business School Online walks through a perceptual map comparing hard seltzer brands on price point and target market. White Claw’s closest competitor turned out to be Corona, a legacy beer brand that had gained ground after entering the category. Craft brands aimed at premium niches and private-label brands at younger, price-sensitive buyers.
The pattern across all three: the map did not confirm what the team already believed. It exposed a competitor nobody was watching, or a part of the market the company had never entered.
For B2B and software teams, the same grid works with different axes: price per seat against depth of features, or self-serve against enterprise sales motion. The principle holds. Pick the two attributes that explain why customers choose one option over another.
How to build a market map, step by step
The process below follows the sequence analysts use for competitive landscape work, adapted for teams who run research through agents and automated workflows.
1. Define the decision the map must support
Write one sentence: “We are deciding whether to enter segment X” or “We are deciding how to reposition against the three nearest rivals.” A map built to answer no particular question becomes a poster. This step costs nothing and is where most weak maps go wrong. It also fixes the audience, so you know whether the output is a slide for a founder or a full report for a client.
2. Draw the boundary of the market
Decide who counts as a competitor. D’Aveni’s price-benefit method, summarized by Harvard Business Publishing, starts by defining the market to include everything customers might consider a competitor or substitute. That means direct rivals, adjacent products, substitutes and emerging entrants. Include the status quo too: for many software categories, a spreadsheet or doing nothing is the competitor.
Set the geography and the segment at the same time. A map of US mid-market project software and a map of global project software are different documents.
3. Choose axes before you touch data
Pick dimensions that are independent of each other and that change buying preference. Price and quality are the classic pair, but they often move together, which makes the map a diagonal line and tells you little. Price against primary benefit, or breadth against ease of use, usually separates players better.
Write down why you chose these axes before you plot anything. It is easy to adjust axes until your own brand lands in a flattering quadrant, and a documented rationale is the guard against that.
4. Gather the data
There are two broad routes.
Customer perception data. For a perceptual map, you first learn which attributes customers use to decide, then survey them to rate each product. MindTools describes rating on a scale such as minus 5 to plus 5 and plotting each product’s average score on a two-axis grid. This is slower, and it is the right tool when the question is how buyers perceive brands.
Observable market data. Pricing pages, search visibility, ad activity, review sentiment, funnel structure and trend signals are all measurable without a survey. This is where agencies and growth teams spend most of their time, and where the work is repetitive: the same set of lookups for every competitor, repeated every quarter.
This is the step Prowl takes off your hands. One connector gives your agent access to 444 tools across 17 market sectors, covering competitive analysis, SEO and ad performance tracking, funnel and review analysis, and pricing and market trend research. Instead of wiring up one integration per data source, you point the agent at a single endpoint and ask for the same data on each competitor in your set. Prowl also lets you request deep reports in which every number traces back to its source, which matters when a client asks where a figure came from.

5. Plot and cluster
Place every player on the grid and look for structure: tight clusters, isolated outliers, and empty regions. Two or three dimensions are enough for a human reader. Add more and the picture stops being legible.
If you are mapping segments rather than companies, size each segment by revenue or search demand so large pockets do not look the same as small ones. Roger Martin’s critique, published on Medium, is worth keeping in mind here: a map draws attention to itself, and anything small on it tends to be ignored. Sizing the bubbles guards against that.
6. Interpret distances, gaps and movement
MarketingProfs lists three things a perceptual map tells you. First, how close customers see your brand to competitors, because proximity implies direct competition. Second, places where no competitor operates or has succeeded. Third, how far you are from the position your target segment wants most.
Then test every gap. Economics Online points out that in its UK supermarket example the high-price, low-quality corner is empty because no customer wants that combination. Before you call a gap an opportunity, ask three questions:
- Do customers in the segment want this combination of attributes?
- Can we deliver and sustain it at a margin that works?
- Would the position be defensible once rivals notice?
7. Turn it into a decision
End with a recommendation: which segment to enter, which rival to target, which message to change. A map that ends in a picture has not finished the job. Prowl can produce the output in the format your audience expects, including interactive reports, PDFs, infographics, PPTX, video and audio, so the same research can become a client deck or an internal brief without rebuilding it.
Market map or competitive landscape report?
The two are close relatives, and many practitioners use the terms interchangeably. A useful distinction:
| Market map | Competitive or market landscape report | |
|---|---|---|
| What it is | A visual placing players or segments on chosen dimensions | A written document that includes the map and explains it |
| Main question | Who is where, and where are the gaps? | What does this structure mean for us, and what should we do? |
| Typical contents | Axes, players, clusters, white space | Segment definitions, competitor profiles, capability comparison, pricing, recommendation, limits of the research |
| Audience | Anyone who needs a quick orientation | Decision-makers who will fund or approve a move |
A market landscape report tends to be broader, covering every player and segment, often with sizing. A competitive landscape report is narrower, focused on the options buyers weigh against you. In both, the written analysis should name the clusters, say which areas are crowded and which are sparse, state what the white space implies and flag the outliers that do not fit your structure.
A solid report usually includes:
- The map itself, with a short note on what each segment means for you.
- Comparable competitor profiles: what each sells, to whom, at what price tiers, with estimates labeled as estimates.
- A capability matrix marking each player as full, partial or none on the features buyers care about.
- A recommendation naming the target customer, the price position and the edge you will claim.
- A sources page that cites every figure and states what the research could not establish.
That last item is where agency work earns trust. Prowl is built around transparent coverage gaps and traceable numbers, which fits that standard: the report says what the data shows and where it is thin.
Keeping the map current
A map is a snapshot. Competitors reprice, launch features, enter new segments and change their ad spend between quarterly reviews. A sensible rhythm is to refresh the data quarterly and to re-plot whenever a major competitor makes a visible move. Prowl’s own guides cover this monitoring side, including how to automate competitor monitoring around a few signals and automated competitor analysis as a repeatable routine.
Once the map points to a gap, the next question is how to act on it: which messages, content and offers to build around the position you have chosen. Guidance on interpreting analytics for content marketing helps connect that finding to growth priorities.
Two habits keep a map honest. First, label every input as a verified fact, a directional signal or an assumption, so a reader can see how much weight each placement carries. Second, check recency and conflicts: if two sources disagree on a competitor’s pricing, record both and mark the point as unresolved rather than picking the convenient one.
Promo: run your next market map through one connector
If your team builds landscape maps often, the slow part is collecting the same data from many tools. Prowl gives your agent one endpoint to 444 market intelligence tools, and the finished research can leave as a PDF, a PPTX deck, an interactive report or other formats. You can pay as you go with pre-paid credits ($10, $50 or $200, one-off) or take a monthly plan: Exploit at $60 per month, Blackops at $120 per month or Syndicate at $240 per month. Recon is also listed on the pricing page. See Prowl’s plans and credits to choose the one that fits your volume.
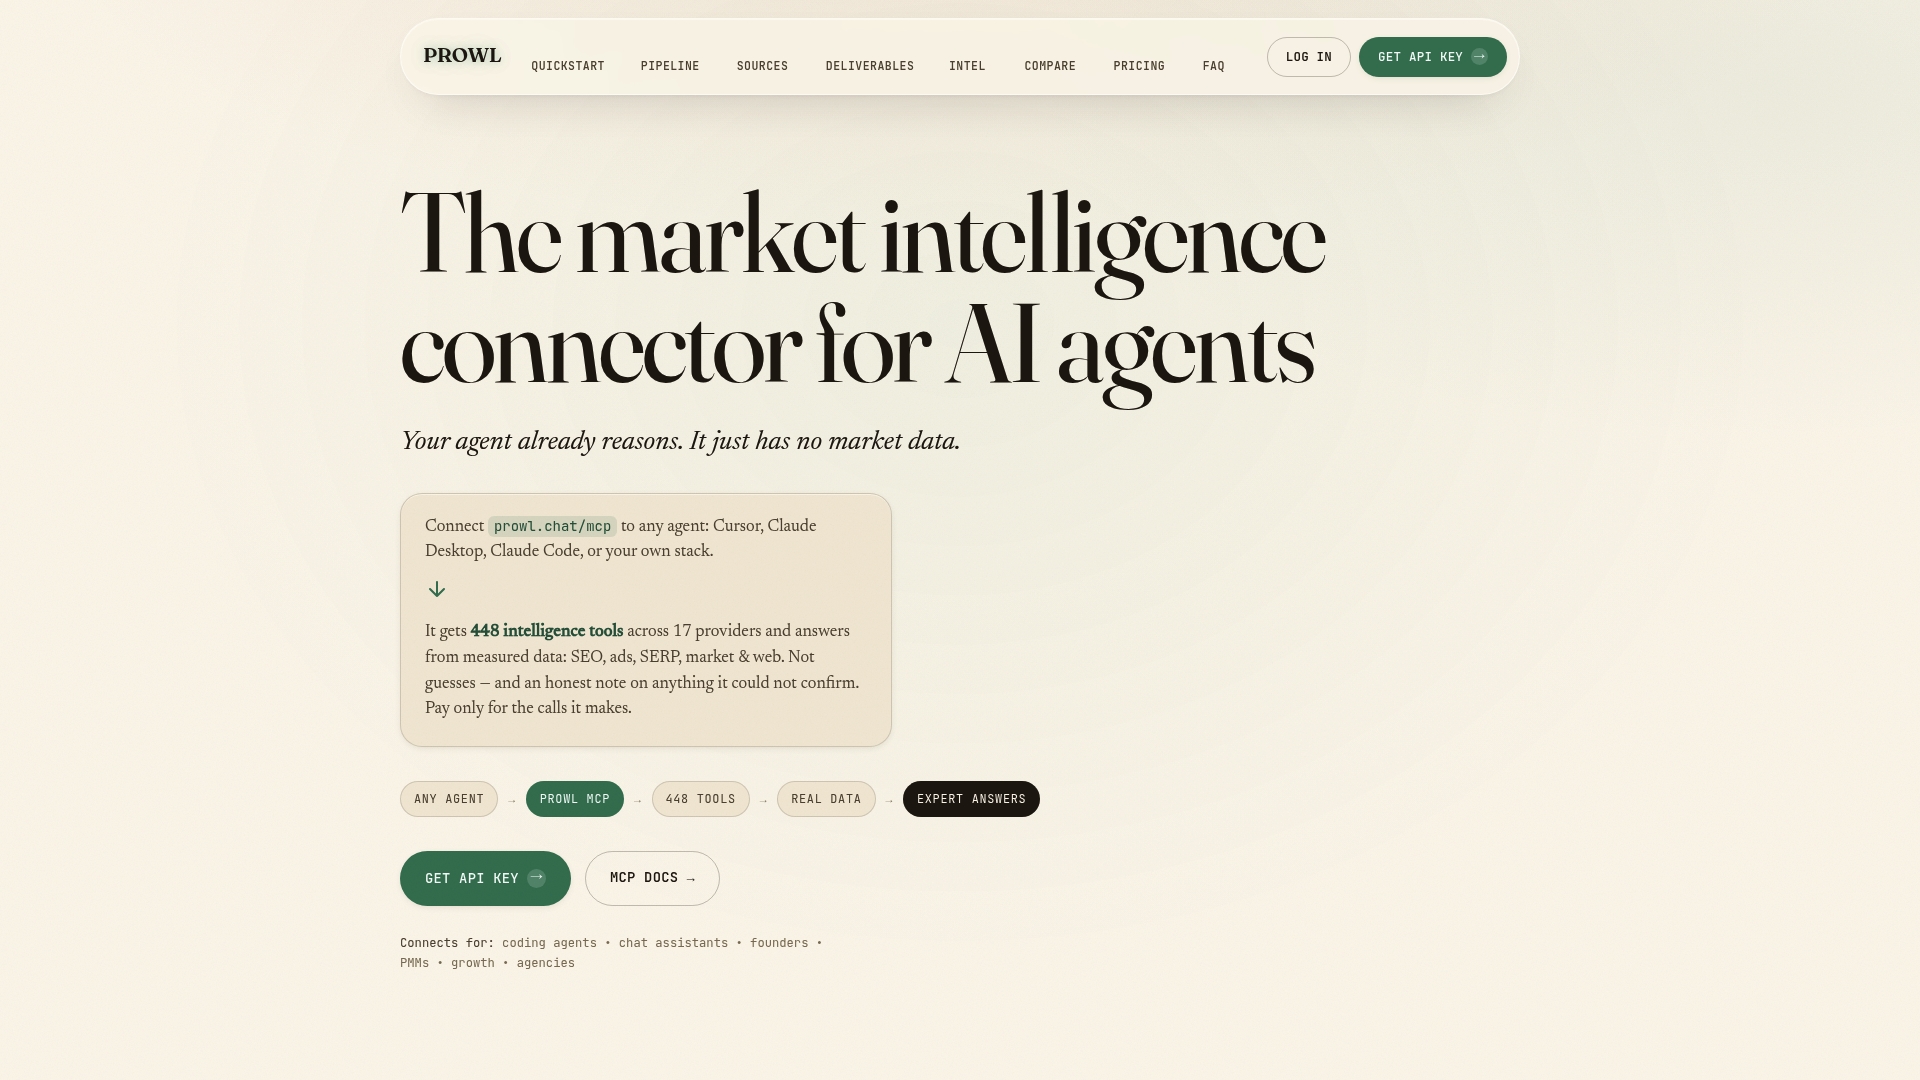
If you work inside an editor, the Cursor MCP server page shows how to bring live market data into that workflow, and the use cases overview lists other ways teams put the connector to work.
Perspective
Most market maps we see described look finished long before they are right. The picture is tidy, the axes are plausible, and the data behind each dot was gathered by hand weeks ago. That is the weakness of the method, and it is fixable.
Our view is that a map should be a query, not a drawing. If the same question can be asked again next month against live data, the map stays useful. That is why we built Prowl around a single access point to 444 tools: the agent that placed your competitors on the grid can place them again when pricing, search visibility or review sentiment shifts.
We also think a number without a source should not be on the map. Our deep reports are designed so every figure traces back to where it came from, and so coverage gaps are stated openly. That makes the white space on your map something you can defend in front of a client or an investor, not just something that looks promising.
Teams that treat mapping as a repeatable routine, with a clear decision, documented axes and refreshed data, make better calls than teams that treat it as a one-off exercise. The method is old. What changed is how fast you can feed it.
Prowl Team
FAQ
What is market mapping analysis?
It is the practice of placing competitors, segments or products on a grid defined by dimensions that matter to buyers, then interpreting what the layout shows. You read clusters as crowded areas, empty regions as possible gaps, and distances as a measure of how directly two players compete. The aim is a decision, such as where to enter or how to reposition.
What is a good example of a market map?
The White Claw case from Harvard Business School Online is a clear one: a perceptual map of hard seltzer brands on price and target market showed that the nearest rival was a legacy beer brand, not another seltzer. McKinsey’s dairy-beverage example is another, where a 20-segment map revealed the company had no presence in almost two-thirds of the attainable market.
How do I create a market map?
Define the decision, set the market boundary, choose two independent axes, gather data on every player, plot and cluster them, then test each gap against customer demand and your ability to serve it. Document your reasoning for the axes before you start. Automated workflows can handle the data-gathering step, which is the most repetitive part.
What is the difference between a competitive landscape report and a market landscape report?
A market landscape report covers every player and segment in a market, usually with sizing and forecasts. A competitive landscape report covers only the options buyers weigh against you. Both pair a visual map with written analysis, and in everyday use the terms are often interchangeable.
How often should I update a market map?
Treat it as a living document. A quarterly refresh is a practical baseline, with an extra update whenever a major competitor changes pricing, launches a product or enters a new segment. Mark each input as verified, directional or assumed so readers know how much to trust each placement.
Sources
- McKinsey: A game of inches, going small to find big growth in consumer goods
- Harvard Business School Online: How to Use Perceptual Mapping to Assess Your Competition
- Harvard Business Publishing: Mapping Your Competitive Position
- MarketingProfs: Market Positioning Using Perceptual Maps
- MindTools: Perceptual Mapping
- Economics Online: Market Mapping, Definition, Example, Pros and Cons
- Roger Martin on Medium: Market Maps Make Me Nervous