
Trend forecasting methods fall into three families: qualitative judgment, time-series projection and causal (driver-based) models. The best forecasters rarely pick one. They match the method to the data they have and the horizon they need, then combine it with a second view. This guide covers each family, how to choose, how to test a forecast, and where live market data fits in. For agencies, analysts, product managers and founders, the third part is usually the bottleneck. Our platform, Prowl, connects an AI agent or workflow to 444 marketing intelligence tools through one API, so the data collection step stops eating the week.
TL;DR
- Use qualitative methods (expert panels, scenarios, surveys) when there is no history. Use time-series methods when you have clean history and the pattern is likely to continue. Use causal models when you understand the drivers or expect big changes.
- Simple methods such as moving averages and exponential smoothing are often as accurate as complex ones, and they are easier to explain to a client or a board.
- Trend analysis explains the past. Forecasting projects it forward. Do the first before the second.
- Combine methods, and judge every forecast by its error against actual results, not by how good the chart looks.
- Most of the effort goes into gathering and cross-checking signals. That is the step to automate.
Table of Contents
- Trend analysis versus trend forecasting
- The three families of trend forecasting methods
- How to choose the right method
- A worked example
- How to forecast market trends with live business signals
- Testing and improving your forecast
- Our perspective on forecasting with live data
- Run your next forecast on live data
- FAQ
- Sources
Trend analysis versus trend forecasting
People use the two terms interchangeably, but they are different jobs. Trend analysis examines historical data to explain its components: the underlying direction, seasonality, cycles and noise. Forecasting then projects future values using methods such as ARIMA, exponential smoothing or neural networks. Analysis is usually the necessary first step before you fit a forecasting model, as Tiger Data’s time-series guide explains.
In practice: if you are asked “why did branded search double last spring?”, that is analysis. If you are asked “how much will it grow next quarter?”, that is forecasting. Skipping the first leads to confident projections of patterns that were really one-off spikes. If you want a structured routine for the analysis half, our six steps to market trend analysis walks through it.

The three families of trend forecasting methods
The Open University’s course on demand management lists three model types: qualitative techniques, time-series analysis and causal analysis. Nearly every method you will meet belongs to one of them.
Qualitative methods
These rely on people rather than numbers: expert panels, market research and structured group techniques. Cornell’s legal encyclopedia describes the Delphi method, scenario writing and subjective approaches as the qualitative toolkit, used when historical data is unavailable.
Typical uses for a growth team or founder:
- A category that did not exist two years ago, so there is no history to project.
- A launch into a new market where your own data does not apply.
- A sanity check on a statistical forecast. Hyndman’s overview notes that qualitative methods also adjust quantitative forecasts with information the model could not incorporate, such as a known competitor launch or a regulation change.
The weakness is consistency: two panels can disagree. Structure helps. Collect independent estimates first, then discuss, then revise.
Time-series methods
Time-series methods use only the past values of the variable itself. Hyndman groups ARIMA, exponential smoothing and structural models here and notes they suit cases where the system is poorly understood or you only need a prediction, not an explanation. The common ones, from simplest up:
- Naive forecast. Next period equals the last period. It is the baseline every other method must beat.
- Moving average. Average the last N periods to smooth noise. A weighted version gives recent periods more weight. Textbooks list naive, moving average and simple exponential smoothing as the standard starting set.
- Simple exponential smoothing. A weighted average where weights decay for older data. Good for series with no clear direction.
- Holt’s linear trend method. Adds a trend term. The catch, per the Forecasting: Principles and Practice chapter on trend methods, is that its forecasts display a constant trend indefinitely, which is rarely realistic.
- Damped trend. Flattens the trend over the horizon. Gardner’s modelling paper recounts that the damping parameter was added after competition results showed straight-line projection was often too optimistic or pessimistic.
- Holt-Winters, ARIMA, Prophet. Add seasonality or richer structure. Use them when the data clearly has seasonal peaks, such as holiday demand or tax-season search.
Causal and regression methods
Causal models relate the thing you forecast to other variables. Cornell’s entry gives examples like interest rates and disposable income. Armstrong describes the procedure as estimating the relationships, forecasting the drivers, adjusting the relationships for the forecast period and computing the forecast.
For marketers the drivers are familiar: ad spend, price, search interest, competitor promotions, review sentiment, seasonality. A regression of weekly sign-ups on ad spend and price is a causal model. The payoff is that you can ask “what if we cut price 10%?”, which a time-series model cannot answer.
How to choose the right method
There is no universally best technique. A 2021 survey of more than 280 publications found that neither human judgment nor quantitative methods wins everywhere. The better choice depends on data availability, quality, extent and format, and combining the two can give more accurate and resilient models.
Armstrong’s chapter in the Principles of Forecasting handbook compares six selection approaches and concludes that guidelines from prior research are a low-cost, effective way to choose. Three of his findings translate directly into a decision table:
- With enough data, quantitative methods beat judgmental ones.
- When large changes are expected, causal methods beat naive ones.
- Simple methods are preferable to complex ones: easier to understand, cheaper, and seldom less accurate.
| Your situation | Start with | Add |
|---|---|---|
| No history (new category, new market) | Expert panel, scenarios, survey | Early signals such as search and ad data as they appear |
| 2+ years of clean history, stable pattern | Moving average or exponential smoothing | Seasonal version if peaks repeat |
| Clear direction in the data | Damped trend | Judgmental adjustment for known events |
| A big change expected (price, regulation, new rival) | Regression on drivers | Scenarios for the driver forecasts |
| High stakes, many signals | Two or three methods side by side | Average the forecasts and note the spread |
The horizon matters too. Short horizons favor time-series methods because momentum persists. Longer horizons depend more on drivers and judgment, because the pattern itself may change.
A worked example
Say a product team tracks monthly searches for a feature category: 100, 104, 109, 113, 120, 124 over six months.
- Baseline. The naive forecast for month seven is 124.
- Three-month moving average. (113 + 120 + 124) / 3 = 119. It lags a rising series, which tells you it understates growth.
- Trend method. The average monthly gain is about 4.8 points, so a straight-line projection gives about 129. A damped trend would land somewhere between 124 and 129, say 127.
- Judgment check. The team knows a competitor launches next month and expects a bump in category interest. They nudge the forecast up modestly and record why.
When month seven arrives, compare each method with the actual. If the damped trend was off by 2 and the moving average by 6, you have learned which to trust for this series. That feedback loop is the real forecasting method.
How to forecast market trends with live business signals
Statistical models need inputs. For market trends, the useful inputs are rarely only your own sales history. Search interest, ad activity, pricing moves, reviews and funnel behavior all lead or confirm demand shifts. Google’s own Trends data is a common starting point: one guide to using Google Trends for market research describes using it to spot recurring demand cycles and compare related queries.
A routine that works for most teams:
- Define the question and horizon. “Will category demand keep growing through next year?” is testable. “What’s trending?” is not.
- Pull history for the target series and its candidate drivers. Search volume, ad spend in the category, competitor pricing, review volume.
- Analyze first. Separate trend, seasonality and noise.
- Fit two or three methods. One simple baseline, one trend method, one driver-based model.
- Cross-reference signals. A rise in search with falling review sentiment and rising competitor discounts tells a different story than search alone.
- Add judgment. Document every manual adjustment and the reason.
- Publish the forecast with a range and the sources behind each number.
Steps 2 and 5 are where agencies and analysts lose days: logging into separate tools, exporting, reformatting and reconciling. This is where we built Prowl to help. It gives your agent or workflow one connection to 444 tools covering SEO, ad performance, funnels, reviews, pricing and market trends, so the signals for steps 2 and 5 come through one endpoint. Reports keep every number traceable to its source, which makes step 7 defensible when a client asks where a figure came from. For more on the workflow, see our guides on AI agent market research and market intelligence platforms.
If you already work with prediction markets or want a research-based primer on structured judgment, this guide to superforecasting practices covers how disciplined forecasters think about probabilities. And because forecasts only matter if they change decisions, it helps to tie them to channel results: this piece on analytics and marketing ROI shows why measurement discipline pays.
Testing and improving your forecast
A forecast you cannot score is an opinion. Quantitative methods are judged by error measures; the standard three are Mean Absolute Deviation, Mean Squared Error and Mean Absolute Percentage Error.
- MAD is the average size of the miss, in the units you forecast.
- MSE squares each miss, so it punishes big errors more.
- MAPE expresses the miss as a percentage, which makes series of different sizes comparable.
Practical habits that improve accuracy:
- Hold out recent data. Fit the model on older periods and test on the last few.
- Always compare against the naive baseline. If a complex model cannot beat it, drop it.
- Combine forecasts. The 2021 survey names combining multiple forecasts as one of four research thrusts, alongside model choice, human-model interaction and forecaster training and incentives.
- Use checklists. Armstrong and Green report that 17 simple methods can together provide accurate forecasts across diverse problems, and that following their checklists can cut errors by more than half compared with commonly used methods. Green’s demand-forecasting paper likewise lists 18 evidence-based methods and eight to avoid, with five checklists.
- Re-forecast on a schedule. Monthly for fast markets, quarterly for slower ones, and log each forecast so you can score it later.
Our perspective on forecasting with live data
Most forecasting failures we see described in the market research world are not model failures. They are input failures: stale exports, one data source standing in for a whole market, numbers nobody can trace.
Our view is that the method matters less than the evidence feeding it. A damped trend on cross-checked data from several providers is a stronger basis for a decision than a sophisticated model on one dashboard export. That is why Prowl exposes 444 tools through a single connection: so an agent can pull search, ad, pricing, review and funnel signals into one workflow and cross-reference them.
We also built it so every number in a report traces back to its source, and so coverage gaps are stated openly. A forecast is only as credible as the answer to “where did this come from?”
The goal is to get analysts out of the data-gathering loop and into the judgment step, where adjustments for launches, regulation and strategy belong.
Prowl Team
Run your next forecast on live data
If your forecast depends on signals from several tools, Prowl lets your agent or workflow reach them through one API. Our plans are published on the pricing page: Exploit is $60 per month, Blackops is $120 per month and Syndicate is $240 per month. You can also fund usage with one-off credits of $10, $50 or $200. Reports can be delivered as interactive reports, PDFs, infographics, PPTX, video or audio, so the forecast arrives in the format your client or leadership team expects.
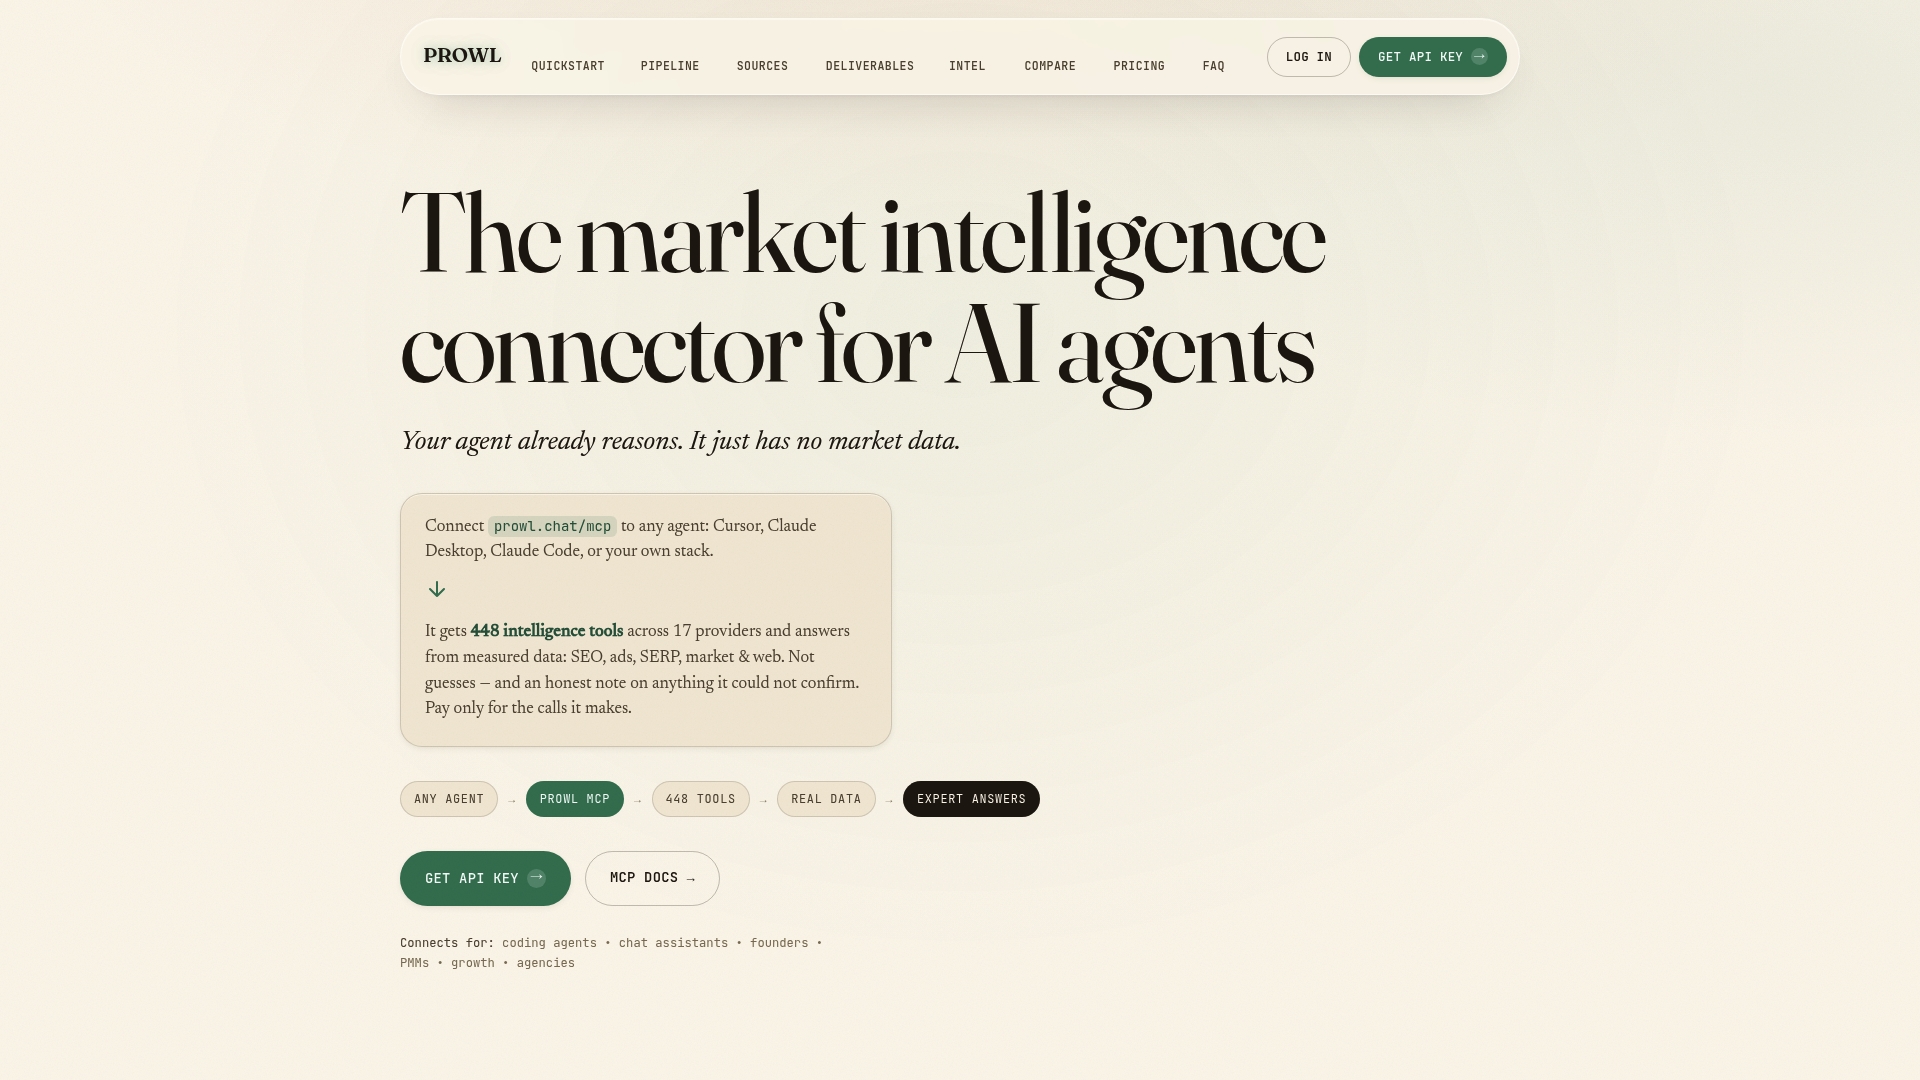
If you use Cursor for analysis, the Cursor MCP server page shows how to connect it. More examples are on our use cases page.
FAQ
What are the main types of forecasting models?
The three broad families are qualitative (expert judgment, Delphi, scenarios), time-series (moving averages, exponential smoothing, ARIMA) and causal (regression on drivers). Many lists split them into four by separating moving averages from smoothing, but the logic is the same. Pick by data availability and by whether you need to explain the forecast or only produce it.
What is Holt’s trend method?
It is an extension of exponential smoothing that tracks both the level of a series and its trend. Its weakness is that it projects the trend at a constant rate indefinitely, so analysts often use the damped version, which flattens the trend over the forecast horizon.
How much history do I need to forecast a trend?
There is no fixed minimum, but seasonal methods need at least a couple of full seasonal cycles to detect repeating peaks. With little or no history, use qualitative methods and early signals, then switch to statistical models as data accumulates.
Can I combine qualitative and quantitative forecasts?
Yes, and the research supports it. A large 2021 survey found combining human judgment with quantitative models can produce more accurate and resilient forecasts. Fit the statistical model first, then adjust it for events the data cannot show, and record each adjustment.
Sources
- Time-Series Analysis: What Is It and How to Use It, Tiger Data
- Capacity and demand management: forecasting methods, Open University
- Forecasting, Cornell Legal Information Institute
- Forecasting overview, Rob Hyndman
- Long-Range Forecasting, Chapter 5, J. Scott Armstrong
- Categories of Forecasting Methods, eCampusOntario
- Forecasting: Principles and Practice, trend methods
- Damped trend exponential smoothing: a modelling viewpoint
- A survey of human judgement and quantitative forecasting, PMC
- Selecting forecasting methods, Principles of Forecasting
- Forecasting methods and principles: evidence-based checklists
- Demand Forecasting: Evidence-based methods and their use
- How to Use Google Trends for Market Research
- Superforecasting guide
- Analytics and marketing ROI