
SEO share of voice is the percentage of estimated organic clicks your site captures across a defined keyword set: divide the clicks you earn by the total estimated clicks available for that set, then multiply by 100. A site pulling 15,000 of 50,000 total monthly clicks across 100 tracked keywords holds a 30% SoV. Treat that number as a trend to watch, not a scoreboard to obsess over.
TL;DR:
- Share of voice requires defining a relevant keyword set and applying a CTR model to estimate actual organic clicks, not just rankings.
- Tracking SoV over multiple periods helps identify genuine trends, seasonal effects, and the impact of content or technical changes.
- Competitive SoV trends can reveal shifts in market leadership and alert teams to both opportunities and threats before traffic metrics catch up.
- Relying solely on a single snapshot or a narrow keyword set can significantly distort SoV accuracy and misrepresent your true competitive position.
- Automating SoV reporting with integrated tools like MCP workflows ensures consistent, reliable data for strategic decision-making.
Table of Contents
- What SEO share of voice actually measures (and why it beats raw rankings)
- Why SEO share of voice matters for marketing and business reporting
- How to calculate SEO share of voice step by step
- SEO vs. PPC vs. social vs. AI search: how share of voice changes by channel
- Tools, metrics, and workflows for tracking SoV without the spreadsheet chaos
- Eight practical ways to improve your SEO share of voice
- Automating SoV reporting so it doesn’t die in a spreadsheet
- What a 30% or 50% SoV score actually tells you
- Where SEO share of voice falls short as a metric
- SoV, competitors, and the market-share question
- Case studies: how SoV shifts show up in the real world
- What the SoV conversation gets wrong
- Get your SoV numbers without the spreadsheet grind
- Sources
What SEO share of voice actually measures (and why it beats raw rankings)
Rankings tell you where you sit. Share of voice tells you how much of the actual demand you’re capturing. That distinction sounds academic until you look at what happens when a single keyword skews the picture.
Say your site ranks #1 for a keyword with 50 monthly searches and #8 for one with 40,000 searches. A rank-based dashboard makes you look dominant. But almost nobody clicks a result buried on page one’s bottom half, so your real share of the traffic pie is tiny. SoV corrects for this because it’s demand-weighted: it multiplies position by search volume, not just position in isolation.
This is why SoV works better than rank tracking for a few specific jobs:
- Budget allocation. SoV shows which keyword clusters are worth more investment because they represent real click volume, not just vanity rankings.
- Benchmarking against competitors. A competitor ranking #3 on ten low-volume terms isn’t beating you if you own the top three spots on the five terms that actually drive traffic.
- Content prioritization. Low SoV combined with high search volume flags where your content is underperforming relative to demand.
- Executive reporting. “We hold 42% share of voice in our core category” lands better with leadership than a list of average position numbers.
The tradeoff: SoV requires more setup than a rank tracker spitting out position 1 through 100. You need a defined keyword set, a CTR model, and consistent data collection. Once that’s running, it becomes the more honest number on the dashboard.
Why SEO share of voice matters for marketing and business reporting
SoV gives marketing a language that finance and leadership already understand: relative market presence. Instead of reporting “we improved average position by 2.3 spots,” you can say “we grew noticeably in share of voice in our category over two quarters.” That framing connects directly to broader ROI conversations, where marketing leaders are expected to show revenue-minus-cost math but also need leading indicators before revenue catches up.
Share of voice tends to move before revenue does. SoV often rises weeks or months before conversions follow, because visibility gains have to accumulate before they turn into pipeline. That makes it one of the few SEO metrics that functions as an early warning system for campaign attribution and competitive benchmarking.
Three use-cases where SoV earns its place on a dashboard:
- Campaign attribution. Track SoV before and after a content push or technical fix to isolate its effect on visibility.
- Competitive benchmarking. Quarterly SoV snapshots against named competitors reveal who’s gaining ground before traffic data confirms it.
- Executive dashboards. A single percentage, tracked over time, is easier for non-SEO stakeholders to digest than a table of keyword rankings.
The caveats matter as much as the number itself. Your keyword set defines your reality. A narrow set inflates SoV; a bloated one dilutes it. CTR model assumptions shift results by several points depending on which curve you apply, and seasonality can swing SoV independent of anything your team did. Report the number, but always report the keyword set and CTR model alongside it.
How to calculate SEO share of voice step by step
Start with the keyword set, because everything downstream depends on it. Pull a list of terms relevant to your category, then cluster them by intent, transactional, informational, navigational, rather than treating them as one undifferentiated pile. Cluster-level SoV is far more diagnostic than a single sitewide number, because it tells you exactly where you’re losing ground.
Here’s the full workflow:
- Define your keyword set. Choose a moderate number of terms that represent your category, weighted toward commercial and informational intent relevant to your business.
- Collect ranking positions. Pull your position and each competitor’s position for every keyword, using a rank tracker or manual SERP checks.
- Assign a CTR curve. Apply an estimated click-through rate per ranking position. These curves vary by query type and device, so validate them against Google Search Console rather than trusting a generic industry curve blindly.
- Estimate clicks per keyword. Multiply each keyword’s monthly search volume by the CTR assigned to your position for that term.
- Sum clicks by domain. Add up estimated clicks across the full keyword set for your site and for each competitor you’re tracking.
- Calculate SoV. Divide your total estimated clicks by the combined total estimated clicks across all tracked domains, then multiply by 100.
- Cross-check against real data. Compare your estimate to actual clicks reported in Search Console for the same keyword set to catch modeling errors early.
Here’s the arithmetic worked through on a small, realistic set:
That 30% figure is exactly the worked example Backlinko uses to illustrate the formula, and it’s a useful anchor because it shows a site that’s clearly leading its keyword set without dominating it outright.
A couple of practical notes from running this repeatedly: don’t let the keyword set go stale. Search behavior shifts, new competitors enter, and a list built eighteen months ago won’t reflect current demand. Test more than one CTR curve against your actual Search Console data before locking in a model, because the “average” curve most guides publish assumes desktop behavior that doesn’t hold for mobile-heavy categories. And resist the urge to react to a single month’s SoV snapshot. One update, one algorithm shift, one seasonal spike can move the number without changing your underlying competitive position. The trend across four to six data points is what tells you something real.

SEO vs. PPC vs. social vs. AI search: how share of voice changes by channel
Share of voice isn’t a single formula ported across channels. Each one measures a different unit of attention, and mixing them without saying so produces reports that look precise but mean less than they seem to.
- SEO SoV is built on estimated organic clicks, derived from position and search volume as described above.
- PPC SoV typically uses impression share or spend-weighted share, since paid placements are bought rather than earned through relevance signals.
- Social SoV usually tracks mentions or impressions across platforms, closer to a brand-awareness metric than a demand-capture one.
- AI search SoV counts how often your brand gets mentioned or cited in responses from large language models, a genuinely different unit than clicks or impressions.
AI visibility measurement is still unsettled. There’s no universal standard yet for how often a model needs to cite you before that counts as meaningful presence, and tooling in this space is younger than rank tracking by a wide margin. That said, traditional search still drives most discovery even as LLMs increasingly shape what people consider before they search. Track AI mentions as a supplementary signal, not yet as a KPI with the same rigor as organic SoV. Keep channel SoVs separate in reporting; a blended number obscures which lever actually moved.
Tools, metrics, and workflows for tracking SoV without the spreadsheet chaos
Most rank trackers now build SoV directly into their visibility scores, applying an internal CTR model to estimate clicks per position and summing across every tracked keyword and competitor domain. That’s convenient, but the CTR model baked into any given tool is a black box unless the vendor documents it, which is exactly why Ahrefs publishes its own SoV formula rather than leaving it opaque: total clicks your site receives from tracked keywords divided by total clicks going to all results for those same keywords.
A workflow that holds up over time usually includes:
- A position tracker or SERP API feeding daily or weekly rank data into your keyword set.
- Google Search Console and Analytics used specifically to validate CTR assumptions against your actual click data, not just to report traffic.
- Scheduled, API-driven reporting that captures SoV automatically rather than relying on someone remembering to pull a report monthly.
- Keyword tagging and intent filtering so your keyword set doesn’t quietly balloon with irrelevant long-tail terms that dilute the signal.
Pro Tip: *Run your CTR model against three months of actual Search Console clicks for your top 20 keywords before trusting it for the full set.
Eight practical ways to improve your SEO share of voice
Some of these move the number within weeks. Others take a quarter or more, but compound.
- Fix pages ranked 4 through 10 first. The fastest SoV gains typically come from pushing already-ranking pages into the top three spots, not from publishing new content from scratch.
- Rewrite metadata on underperforming pages. A weak title tag or meta description on a page ranking #6 can suppress clicks even when the position itself is decent.
- Add internal links to priority pages. Pages starved of internal links rarely climb, regardless of content quality.
- Cluster content around intent, not just keywords. Group transactional, informational, and comparison content so each cluster has its own SoV signal instead of one messy sitewide average.
- Repurpose your best-performing content. A strong guide can be split into supporting pages that each target adjacent long-tail demand.
- Build links to the pages that actually carry volume. Spread-thin link building across the whole site helps less than concentrated authority on the ten pages that matter.
- Fix technical basics: speed, mobile rendering, structured data. These affect both traditional rankings and your odds of being cited in AI-generated answers.
- Design before-and-after measurement into every change. Snapshot SoV before a content push or technical fix, then compare after a full reporting cycle, so you can attribute movement to a specific action instead of guessing.
For a structured way to spot where competitors are outpacing you on specific clusters, a competitor gap analysis workflow can surface the exact terms worth prioritizing from this list.
Automating SoV reporting so it doesn’t die in a spreadsheet
Manual SoV tracking breaks down for a predictable reason: someone has to pull rankings, apply a CTR model, cross-reference competitor data, and rebuild the spreadsheet every reporting cycle. Skip a cycle, and the trend line you needed for benchmarking has a gap in it.
An MCP-based workflow, where an AI agent connects directly to market intelligence tools, handles this differently. It ingests ranking positions, search volume, and a chosen CTR model, pulls competitor data for the same keyword set, and outputs a scheduled report without anyone touching a spreadsheet. That kind of pipeline, built on something like Prowl’s 448-tool connector, removes the bottleneck where reporting cadence depends on whoever remembers to run it.
The workflow that tends to work best:
- Define and tag the keyword set once, then let ingestion handle updates.
- Select a CTR model and revisit it quarterly against Search Console data.
- Pull competitor positions automatically rather than manually checking SERPs.
- Schedule reports so SoV trends are visible without a manual pull every time leadership asks.
Automation doesn’t replace validation. Spot-check estimates against Google Search Console and Analytics periodically, because even the best CTR models are assumptions until you’ve confirmed them against real click data.
What a 30% or 50% SoV score actually tells you
A number without context is just a number, so here’s what these figures mean in practice. A 30% SoV, the example Backlinko walks through, usually means you’re a strong player in your category but not dominant. You’re likely outranking most competitors on your priority terms while ceding meaningful ground on others.
A 50% SoV puts you in a different category entirely. Holding half the estimated clicks across a defined keyword set against every other domain combined usually signals category leadership, the kind of position where competitors are fighting over the remaining half rather than challenging your core terms directly.
Below 15% to 20% in a competitive category generally means you’re a minor player on the keyword set you’re tracking, even if a handful of individual rankings look decent in isolation.
Context always matters more than the raw percentage. A 30% SoV in a category with three competitors reads very differently than 30% in a category with fifteen. A 30% SoV built on 20 keywords is far less stable than the same percentage built on 200, because a handful of ranking swings can move a small set dramatically. Always report the size and composition of the keyword set next to the percentage, or the number invites the wrong comparison.
Where SEO share of voice falls short as a metric
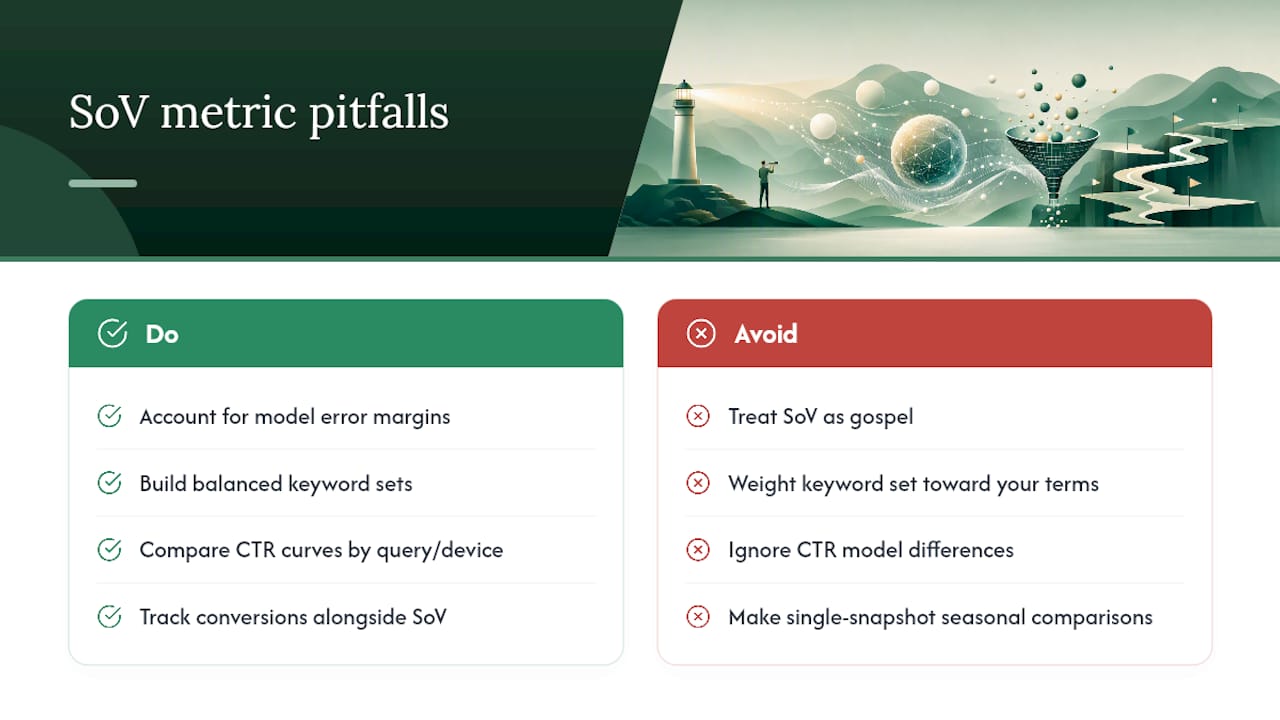
SoV is a modeled estimate, not a measured fact, and treating it as gospel is the most common mistake teams make with it. Every number in the calculation, search volume, CTR by position, even ranking data itself, carries some margin of error that compounds as it moves through the formula.
Keyword set selection is the biggest lever for distortion. Build a set weighted toward terms you already dominate, and SoV inflates in a way that flatters your team but misleads leadership. Build one weighted toward terms a competitor owns, and it does the opposite. Neither is dishonest exactly, but both produce a number disconnected from your actual competitive reality.
CTR models introduce their own uncertainty. Position-one CTR assumptions vary meaningfully depending on query type, device, and whether the SERP includes features like featured snippets or shopping carousels that eat into clicks regardless of organic position. Two teams using different CTR curves on identical ranking data can land on noticeably different SoV figures for the same keyword set.
Seasonality distorts single-snapshot comparisons. A category with holiday-driven search spikes will show SoV swings that have nothing to do with SEO performance and everything to do with when in the year you happened to measure.
And SoV says nothing about conversion quality. A visitor who clicks and bounces counts the same as one who converts. High SoV with declining revenue is a real pattern worth investigating, not a contradiction to explain away.
SoV, competitors, and the market-share question
Share of voice functions as a proxy for market share in organic search specifically, not market share in the broader business sense. That distinction gets lost often enough that it’s worth stating plainly: a company can hold commanding SoV in its category and still lose overall market share to a competitor winning through paid acquisition, retail partnerships, or brand loyalty that never touches organic search.
Within organic search, though, SoV against named competitors is one of the more honest competitive signals available. Tracking three to five direct competitors across the same keyword set over time reveals who’s actually gaining ground, because it accounts for both ranking position and the demand behind each term. A competitor that looks aggressive in a press release might be losing SoV quietly while you gain it, and that’s the kind of signal a rankings-only view misses entirely.
The relationship works both directions. Rising competitor SoV on your core terms is an early warning that they’re either publishing better content, building more relevant links, or fixing technical issues you haven’t addressed yet. Falling competitor SoV, conversely, often signals an opportunity window, a site redesign gone wrong, a Google update that hit them disproportionately, or a content strategy shift that opened gaps in their coverage. Watching competitor SoV trends alongside your own turns the metric from a self-assessment tool into genuine competitive intelligence.
Case studies: how SoV shifts show up in the real world
The clearest way to understand SoV’s value is watching it move across a real timeline rather than staring at a single snapshot. Consider a mid-sized SaaS company that redesigned its pricing and comparison pages over one quarter. Rankings on the target keyword set barely shifted, most terms moved one or two positions.
A different pattern shows up when a competitor’s algorithm hit reshuffles a category. If a dominant player loses visibility broadly following a core update, competitors don’t need to do anything differently to see their SoV climb, the denominator effectively redistributes as the leader’s estimated clicks fall. This is why SoV tracking works best in pairs: your absolute number, and the same number for your two or three closest competitors, tracked on the same cadence.
The pattern that shows up most consistently in longitudinal tracking is that SoV moves in stair-steps rather than smooth curves. It holds flat for weeks, then jumps after a content push or technical fix clears Google’s indexing and re-ranking cycle, then flattens again. Teams that check SoV weekly often misread that flat stretch as stagnation and abandon a strategy just before it would have shown results. The teams that stick with quarterly comparisons tend to make steadier calls.
What the SoV conversation gets wrong
Most guides treat SEO share of voice like a finished number you calculate once and report on. That’s backwards. The real value shows up in the second, third, and tenth measurement, when you can finally see whether last quarter’s content push actually moved the needle or whether you were just watching noise.
The bigger blind spot is AI search. Teams are still treating LLM visibility as a curiosity while it quietly becomes part of how buyers form consideration sets before they ever open a search bar. You don’t need a perfect AI SoV model yet. Nobody has one. But ignoring it while perfecting your organic CTR curve is optimizing the wrong decimal place.
Prioritize this: pick one keyword set, cluster it by intent, and commit to measuring it the same way every month for two quarters before you trust any conclusion. Consistency beats precision here. A slightly wrong number tracked consistently tells you more than a perfect number measured once.
— Sergey
Get your SoV numbers without the spreadsheet grind
Everything in this guide, the keyword clustering, the CTR modeling, the competitor ingestion, the Search Console validation, is a manual process most teams cobble together across three or four separate tools. Prowl removes that assembly step entirely: one MCP connects your agent or workflow to 444 market intelligence tools, so pulling rankings, estimating clicks, and tracking competitor SoV happens inside a single automated pipeline instead of a monthly spreadsheet fire drill.

That matters most for teams reporting SoV to leadership on a recurring cadence, since the value of this metric comes almost entirely from consistent, longitudinal tracking rather than a one-off calculation. Prowl handles the ingestion and report generation so your team spends time interpreting trends instead of rebuilding formulas. If you’re running competitive intelligence, ad performance tracking, or SEO reporting across multiple clients or brands, the use cases page shows how the workflow scales beyond a single keyword set.
Ready to see it running on your own keyword list? Connect your agent to Prowl and generate your first automated SoV report this week.
Sources
- How to Calculate Share of Voice (+ Why it Matters for SEO) — Backlinko
- Calculate share of voice — MetricsWatch