
Marketing attribution modeling assigns conversion credit across the touchpoints that led to a sale, so you can see which channels actually earn budget. The practical rule: match the model to your sales-cycle length and data volume, and anchor everything to first-party, payment-joined conversions before layering on multi-touch or algorithmic weighting. Get that foundation right first; the model you pick matters far less than the data feeding it.
TL;DR:
- Using data-driven attribution requires sufficient conversion volume, so start with time-decay or position-based models if you process fewer than a few dozen conversions weekly per channel.
- Combining MMM with MTA provides a strategic baseline and tactical insights, but both need multi-year data to deliver stable, reliable results.
- Proper attribution relies on building a central touch log from web, ad, CRM, and payment data, with clear identification and real-time joins to maintain accuracy.
- Falling into platform-report bias, confusing correlation with causation, and neglecting awareness channels can severely undermine attribution accuracy.
- Automating data collection with tools like Prowl reduces manual effort and enables faster, more consistent channel analysis without building custom pipelines.
Table of Contents
- What Marketing Attribution Modeling Actually Measures
- What Are the Main Types of Attribution Models?
- Where Does Attribution Data Actually Come From?
- MMM vs MTA: Which Measurement Approach Fits?
- How Do You Choose the Right Attribution Model?
- What Does Attribution Implementation Actually Require?
- What Mistakes Undermine Attribution Accuracy?
- How Prowl Speeds Up Attribution Plumbing
- The Trade-Off Nobody Budgets For
- Get Your Attribution Data Working Without the Manual Stitching
- Sources
What Marketing Attribution Modeling Actually Measures
Every customer path is a chain of touchpoints. An ad click, an organic search visit, an email open, a retargeting impression, even an AI answer engine citation now counts as a distinct signal worth tracking. Attribution modeling takes that chain and assigns fractional or full credit to each stop, turning a messy sequence of interactions into a number finance and leadership can act on.
That number drives budget allocation directly. If paid search gets credit for 60% of pipeline but only receives 20% of spend, that’s a signal, not a guess. Say a buyer sees a display ad, clicks a retargeting ad two weeks later, then converts after a branded search. A last-touch model hands 100% of the credit to search. A time-decay model spreads it, weighting the branded search heaviest but still crediting the earlier ads that built awareness.
What attribution should produce, at minimum:
- A defensible revenue-per-channel figure finance will actually trust
- Enough granularity to catch underfunded channels quietly driving conversions
- A baseline for testing budget shifts before you make them
What Are the Main Types of Attribution Models?
Single-touch models are the easiest to defend and the easiest to get wrong. First-touch gives 100% of the credit to the initial interaction, useful when you’re measuring top-of-funnel awareness spend in isolation. Last-touch gives everything to the final click, which works fine for short, impulse-driven purchases but badly misrepresents anything with a real consideration phase.
Multi-touch models split credit across the path:
- Linear distributes credit evenly across every touchpoint. It’s simple and transparent but treats a passive display impression the same as a demo request.
- Time-decay weights recent touches more heavily, often on an exponential curve, which suits longer sales cycles where late-stage nudges matter more.
- Position-based (U-shaped) gives roughly 40% to the first touch, 40% to the last, and splits the remaining 20% among the middle. W-shaped adds a third anchor at the lead-conversion or opportunity-creation stage, common in B2B pipelines.
- Full-path extends W-shaped logic across the entire deal, including post-opportunity touches like a proposal review or contract negotiation.
- Custom weighted models let you hand-assign credit by channel based on internal knowledge, useful when you have a hypothesis but not yet enough volume for statistics to confirm it.
- Data-driven (algorithmic) attribution uses machine learning to compare converting paths against non-converting ones and assigns credit based on actual incremental contribution, not a fixed rule. Google’s own documentation is explicit that this only works with sufficient conversion volume; sparse data produces unstable weights that shift wildly month to month.
If you’re running fewer than a few dozen conversions a week per channel, skip data-driven attribution and start with time-decay or position-based instead. Rule-based models are easier to implement but less precise than modeled approaches, so treat them as a starting point, not a permanent home.
Where Does Attribution Data Actually Come From?
Attribution is only as honest as the signals feeding it, and those signals come from four main sources: web and app event tracking, ad platform APIs, CRM records, and payment processors. None of them is complete on its own.
- Web and app events capture clicks, page views, and form fills, tagged with UTM parameters or a first-party cookie
- Ad platform APIs (Google Ads, Meta, LinkedIn) report impressions and clicks, but each platform tends to over-credit itself
- CRM systems log lead source, opportunity stage, and sales-assisted touches that never show up in web analytics
- Payment processors confirm the transaction actually happened and for how much
Deterministic identity, built on logged-in sessions or a persistent first-party ID, ties a person to their full path with certainty. Probabilistic matching fills gaps using device fingerprinting or statistical modeling, which scales further but introduces error you can’t fully audit. Practitioner guidance increasingly favors payment-joined conversions as the most trustworthy unit in the whole system, because a settled charge, reconciled against a touch log, is a fact rather than a probability.
Attribution windows (7-day click, 1-day view, 30-day click, whatever you set) determine how far back a touchpoint can still claim credit. Shorten the window and you’ll systematically undercount upper-funnel channels; lengthen it and you risk crediting touches that had nothing to do with the actual decision.
Pro Tip: Run your attribution window at two lengths simultaneously, say 7 days and 30 days, and compare the delta by channel. A channel that looks strong only at 30 days is probably an assist, not a closer, and your budget conversation should reflect that.
MMM vs MTA: Which Measurement Approach Fits?
Marketing mix modeling (MMM) and multi-touch attribution (MTA) answer different questions, and treating them as competitors wastes both. MMM works from aggregate historical data, weekly spend and revenue across channels, including offline media MTA can’t see at all: TV, radio, out-of-home. MTA works at the individual path level, tracking a specific person’s clicks and conversions.
- MMM fits organizations with substantial offline spend, longer historical datasets, and a need for strategic, quarterly budget baselines
- MTA fits digital-heavy channel mixes where you need weekly or even daily optimization signals
- Scale matters for both: MMM needs multi-year history to stabilize its coefficients, while MTA needs enough conversion volume per channel to avoid noisy attribution weights
The IAB’s unified measurement framework recommends a three-step calibration pattern rather than picking one and ignoring the other. First, MMM establishes the aggregate baseline, including channels MTA can’t track. Second, you align MTA’s channel-level coefficients against that baseline so digital attribution doesn’t overstate its own contribution. Third, you recalibrate on a fixed cadence, quarterly is common, as spend mix and market conditions shift. Teams running both in tandem get a strategic floor and a tactical dashboard instead of two disconnected numbers arguing with each other.
How Do You Choose the Right Attribution Model?
Run through this checklist before touching a dashboard:
- Business objective — are you optimizing for lead volume, pipeline value, or revenue?
- Funnel stage focus — top-of-funnel awareness or bottom-of-funnel conversion?
- Sales cycle length — same-day purchase or a six-month enterprise deal?
- Channel mix — is there meaningful offline spend that MTA alone will miss?
- Per-channel conversion volume — enough for data-driven modeling, or still building toward it?
- Engineering resources — can your team wire a real touch log and payment join, or are you stuck with platform defaults?
- Privacy restrictions — do cookie consent rates or regulatory limits cap how much you can track deterministically?
From there, the decision rules practically write themselves. Short sales cycles with low consideration point toward last-touch or time-decay. Long, multi-stakeholder cycles need multi-touch or, once volume supports it, data-driven attribution. Any meaningful offline presence means MMM has to be part of the picture, not an afterthought.
Pro Tip: Never switch your primary model based on a single month of data. Run the candidate model in parallel with your current one for at least one full sales cycle, then compare which one better predicted actual closed revenue before making it official.
Once you’ve picked a model, test it against reality rather than trusting it outright. Run holdout experiments, cut a channel entirely for a defined period, and check whether conversions actually drop by the amount your model predicted. Monitor confidence intervals on data-driven weights; if they swing wildly month to month, your volume isn’t there yet.
What Does Attribution Implementation Actually Require?
The minimum viable stack has four pieces: first-party event collection on your site or app, a server-side visitor ID that survives cookie restrictions, a CRM join that ties leads to revenue, and a payment webhook that confirms the charge actually settled.
- Build a central touch log that every source (ads, email, organic, CRM) writes into, rather than reconciling five separate exports by hand
- Set up near-real-time joins where possible; batch ETL running once a day is workable but delays your ability to catch a broken pixel
- Handle view-through impressions and offline touches (a trade show scan, a phone call) as explicit entries in the same log, not a footnote
- Wire a persistent client reference ID through checkout so the payment webhook can be reconciled deterministically against the touch log
- Track an “unattributed” bucket explicitly. A growing unattributed percentage is often the first sign your identity resolution is degrading, not a rounding error to ignore
Data hygiene matters as much as the pipeline itself: dedupe events, keep a consistent channel taxonomy across teams, and never mix a 7-day lookback report with a 30-day one in the same dashboard without labeling which is which.
What Mistakes Undermine Attribution Accuracy?
Three mistakes show up constantly. Platform-reported bias tops the list: every ad platform’s own dashboard tends to over-credit itself, since each one only sees its own touches. Confusing correlation for causation is close behind, a channel appearing in most converting paths doesn’t mean it caused the conversion. Over-optimizing toward attributed conversions specifically can also quietly starve channels that build awareness but rarely get last-touch credit.
Governance fixes most of this:
- Designate one system of record, ideally the payment-joined touch log, as the single source of truth over any single platform’s self-reported numbers
- Document model assumptions in writing so a new analyst doesn’t quietly change weights without anyone noticing
- Set a fixed review cadence, monthly for model performance, quarterly for a full recalibration
- Run incrementality tests before any major budget reallocation, and name an owner responsible for escalating when numbers disagree
How Prowl Speeds Up Attribution Plumbing
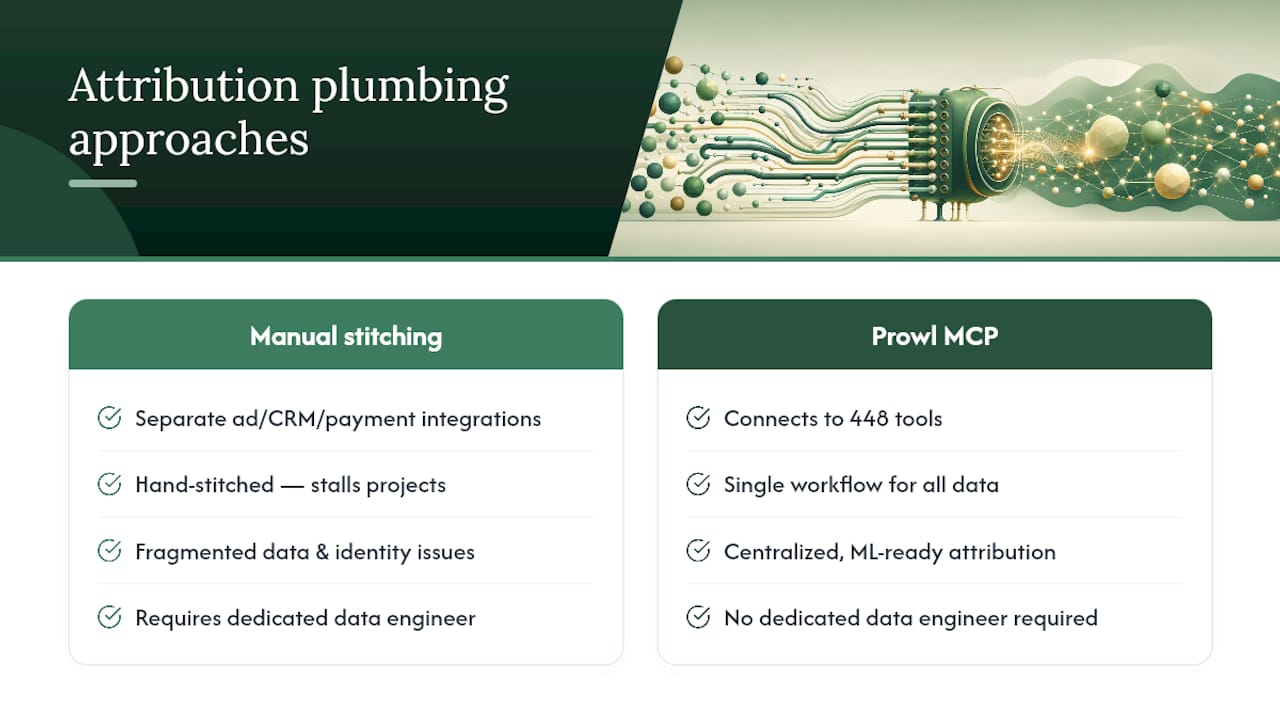
Building a central touch log usually means stitching together ad APIs, CRM exports, and payment data by hand, which is where most attribution projects stall; our partner’s guide on Amazon Ad Tracking for E-Commerce Marketers offers valuable insights for handling fragmented data and identity resolution in such setups. Prowl connects any AI agent to 444 market-intelligence tools through one MCP, so an analyst can pull SEO, ad performance, and competitor data into a single workflow instead of managing separate integrations. That centralization is what makes ML-ready, data-driven attribution feasible for teams without a dedicated data engineering group.
Sergey covers market intelligence platforms and measurement infrastructure for Prowl’s editorial team.
The Trade-Off Nobody Budgets For
Most teams underestimate the engineering time attribution actually costs and overestimate what off-the-shelf platform defaults will tell them. A realistic phased build looks like: instrument first-party events, join CRM and payment data, then model, then test, usually three to six months for a mid-market team. Skip straight to data-driven modeling before you have deterministic payment-joined data, and you’re optimizing on noise.
— Sergey
Get Your Attribution Data Working Without the Manual Stitching
If you’ve read this far, you already know the hard part of attribution isn’t picking a model. It’s wiring together ad platform exports, CRM revenue joins, and payment data without losing a week to spreadsheet reconciliation every month. Prowl gives analysts one connector to 444 market-intelligence tools, so pulling ad performance, SEO signals, and competitor benchmarks into the same report happens in one workflow instead of five logins.

Check the attribution and reporting use cases to see how teams are running channel analysis without custom-building a data pipeline first, then connect your first agent to start generating reports today.
Sources
- Marketing attribution: A complete guide to attribution models — Adobe for Business
- Google Analytics support — data-driven attribution