
Insights automation is the practice of connecting data pipelines, machine learning models, and orchestration tools so a system detects a pattern, generates the insight, and triggers an action without a human running the analysis by hand. A platform like Prowl does this for market and competitive data, while manufacturing tools track metrics like OEE (overall equipment effectiveness) and MTTR (mean time to repair) to catch problems before they cascade.
The verdict: pilot insights automation the moment you have one clean data source and one KPI everyone agrees on. Don’t wait for a perfect data warehouse. Scope a two-week test around a single metric, prove it moves the needle, then expand.
Three things to do before you write a line of code or sign a contract:
- Pick one KPI that already gets discussed in weekly meetings, so the win is obvious to stakeholders.
- Identify the single data source feeding that KPI and confirm it updates on a schedule you can automate against.
- Write down your success criteria in advance, including what counts as a false positive.
Pro Tip: If you can’t name your KPI’s current baseline number off the top of your head, you’re not ready to automate it yet. Automation amplifies whatever discipline already exists in your reporting.
Key Takeaways
Insights automation works when a clean data source, one agreed-upon KPI, and a named owner combine with a pipeline that closes the loop from insight to action.
| Point | Details |
|---|---|
| Definition | Insights automation pairs automated insight generation with automated action, closing the loop that traditional dashboards leave open. |
| Start with one KPI | Pick a metric like OEE or MTTR that’s already tracked manually, then automate the detection and response around it. |
| Pilot in stages | Run a 30 to 90 day pilot with fixed success criteria before deciding whether to scale to a second use case. |
| Platform vs point tools | Choose an integrated platform when you need multiple data sources fast; choose point tools only for a single, narrow use case. |
| Try a single-API approach | Prowl connects agents to 444 intelligence tools through one API, useful for prototyping automated market and competitive reports quickly. |
Table of Contents
- What Is Insights Automation, Exactly?
- How Does the Insight-to-Action Pipeline Work?
- What Technologies Power Insights Automation?
- Where Does Insights Automation Deliver the Most Value?
- How Do You Build an Insights Automation Pilot?
- Should You Choose a Platform or Stitch Together Point Tools?
- What Does a Single-API Insights Platform Look Like in Practice?
- What Goes Wrong With Insights Automation?
- How Should Teams Manage the Shift to Automated Insights?
- Which KPIs Actually Prove Automated Insights Are Working?
- What Should You Compare Beyond Tools and Architecture?
- What Legal and Ethical Issues Come With Automated Decision-Making?
- When Does Insights Automation Actually Deliver Value?
- Ready to Prototype Agent-Driven Reporting?
- Sources
What Is Insights Automation, Exactly?
Insights automation, often described under the broader banner of augmented analytics, is the pairing of automated insight generation with automated action. The analytics layer doesn’t just produce a dashboard someone has to interpret. It flags what matters and, in mature setups, triggers the next step itself, whether that’s a Slack alert, a maintenance ticket, or a pricing adjustment.
This differs from traditional business intelligence in one critical way: a BI dashboard waits for a human to look at it. Insights automation closes the loop. The system watches the metric, decides something is worth flagging, and either notifies the right person or fires an automated response.
Six components make up most working implementations:
- Data ingestion: pulls raw data from sensors, databases, APIs, or event streams into a usable format.
- Data model or feature store: organizes raw data into consistent, queryable structures the analytics layer can trust.
- Analytics or machine learning layer: applies statistical models or trained algorithms to detect patterns, anomalies, or forecasts.
- Insight generation and interpretation layer: translates model output into a plain-language signal, like “downtime risk rising” instead of a raw probability score.
- Action or orchestration layer: routes the insight to a person, a workflow tool, or an automated system that takes the next step.
- Feedback loop: captures whether the action worked, feeding that outcome back into the model to improve future accuracy.
A platform like Prowl sits mostly in the ingestion and insight-generation layers for market intelligence work, connecting to 444 tools through a single API so an agent can pull competitor pricing, SEO rankings, or ad performance data and turn it into a report without wiring up each source individually.
How Does the Insight-to-Action Pipeline Work?

The pipeline runs in five stages: ingest data, analyze it, surface an insight, trigger an action, then verify the outcome and feed it back into the model. Each stage produces a concrete artifact you can point to and audit.
Start with a raw event stream. A factory floor sensor logs a temperature reading every second. A marketing platform logs an ad impression every time it fires. Neither is useful on its own; it’s just noise until something aggregates it.
Next, that stream gets converted into derived metrics. The raw temperature readings become a rolling average compared against a threshold. The ad impressions become a cost-per-click trend line. This is where most of the analytical work happens, and it’s the layer observability practices in IT operations rely on heavily, combining telemetry and analytics to catch problems before they become outages.
From derived metrics comes the automated alert. The system decides the rolling average has crossed a threshold and flags it, ideally in language a non-technical stakeholder understands rather than a raw z-score.
Then comes the orchestrated action. This is the step that separates insights automation from a glorified dashboard: the alert triggers a workflow. A maintenance ticket gets created. A bidding rule adjusts. A report gets generated and sent to a distribution list automatically.
Finally, reconciliation. Someone or something checks whether the action produced the intended result, and that outcome updates the model or the rule set.
A pilot checklist for testing this pipeline end-to-end:
- Confirm the raw data source is stable and updates on a known schedule.
- Build one derived metric and validate it against a manual calculation.
- Set an alert threshold based on historical data, not a guess.
- Wire the alert to a single, low-risk action, like a notification rather than an automatic purchase order.
- Run the loop for two weeks and log every false positive.
Pro Tip: Noisy triggers kill adoption faster than bad models do. If your alert fires more than once a day and half those alerts get ignored, tighten the threshold before you add more automation on top of it. Nobody trusts a system that cries wolf.
What Technologies Power Insights Automation?
Seven technology families typically show up in a working insights automation stack: AI/ML, BI/DI tools, RPA, workflow orchestration, event streaming, IoT/sensors, and metadata catalogs. Most organizations already own two or three of these and are missing the connective tissue between them.
- AI/ML models detect patterns and forecast outcomes that rule-based systems miss, particularly for anomaly detection in noisy data.
- BI/DI (business intelligence/data integration) platforms aggregate and visualize data, and tools like UiPath Insights pair pre-built dashboards with the operational data already flowing through an automation suite.
- RPA (robotic process automation) executes the action step, filling forms, moving files, or triggering downstream systems once an insight is confirmed.
- Workflow orchestration tools sequence multi-step actions across systems that don’t natively talk to each other.
- Event streaming platforms move data in near real time, which matters when your action needs to happen in seconds, not hours.
- IoT and sensor networks generate the raw signal in physical environments, and industrial automation increasingly depends on this layer to feed analytics that improve manufacturing efficiency.
- Metadata and catalog tools track where data comes from and how it’s been transformed, which becomes essential once you’re troubleshooting a bad insight.
The friction usually shows up at the seams. Schema drift breaks pipelines when an upstream system changes a field name without warning. Latency mismatches cause a real-time alert system to choke on a batch-processed data source. And model operations, keeping a machine learning model accurate as underlying data shifts, gets neglected once the initial pilot excitement fades.
Where Does Insights Automation Deliver the Most Value?
Manufacturing OEE and quality control, predictive maintenance, energy optimization, and automated marketing insights are the four domains where insights automation shows up most consistently in production environments. Each has a track record of clear, measurable wins because the KPIs are already standardized across the industry.
| KPI | Definition | Why it matters |
|---|---|---|
| OEE | Percentage of planned production time that’s truly productive | Combines availability, performance, and quality into one number manufacturers already track |
| MTTR | Average time to repair a failure after it’s detected | Shorter MTTR means less downtime and faster recovery from equipment issues |
| Defect rate | Percentage of units failing quality checks | Directly tied to waste, rework costs, and customer complaints |
| Throughput | Units produced per unit of time | Reveals whether process changes actually increase capacity |
| Energy use | Consumption per unit produced or per shift | A cost lever that automated insights can flag in near real time |
| Conversion uplift | Change in conversion rate after an intervention | The marketing-side equivalent of OEE for campaign performance |
Insights Hub is built specifically around OEE tracking, root-cause analysis, and energy management, pairing analytics with a production copilot that recommends corrective actions rather than just reporting a number.
Automated actions tied to these use cases tend to follow a pattern:
- Manufacturing quality: automated downtime alerts fire the moment OEE drops below a threshold, before a shift supervisor would notice manually.
- Predictive maintenance: sensor data triggers scheduled maintenance windows before a part actually fails, avoiding unplanned downtime.
- Energy optimization: automated parameter adjustments cut consumption during off-peak production without a human tweaking dials.
- Marketing analytics: automated report delivery pushes a competitor pricing summary or SEO ranking shift straight to a Slack channel the moment it happens.
How Do You Build an Insights Automation Pilot?
A workable pilot has five fixed elements: a narrow scope, one or two data sources, a single KPI, a named owner, and a hard timeframe, typically 30 to 90 days. Skip any one of these and the pilot tends to drift into an open-ended research project nobody finishes.
- Run a data readiness test: pull a sample of your target data source and check for missing values, inconsistent timestamps, and duplicate records.
- Build your ingestion connector list, prioritizing the one or two sources that feed your chosen KPI.
- Write the simplest possible logic to generate the insight, a threshold rule is fine for a first pass; save the machine learning model for phase two.
- Wire the action, whether that’s an RPA bot filing a report or an API call updating a dashboard.
- Set up monitoring and a rollback plan before you go live, not after something breaks.
A realistic pilot timeline:
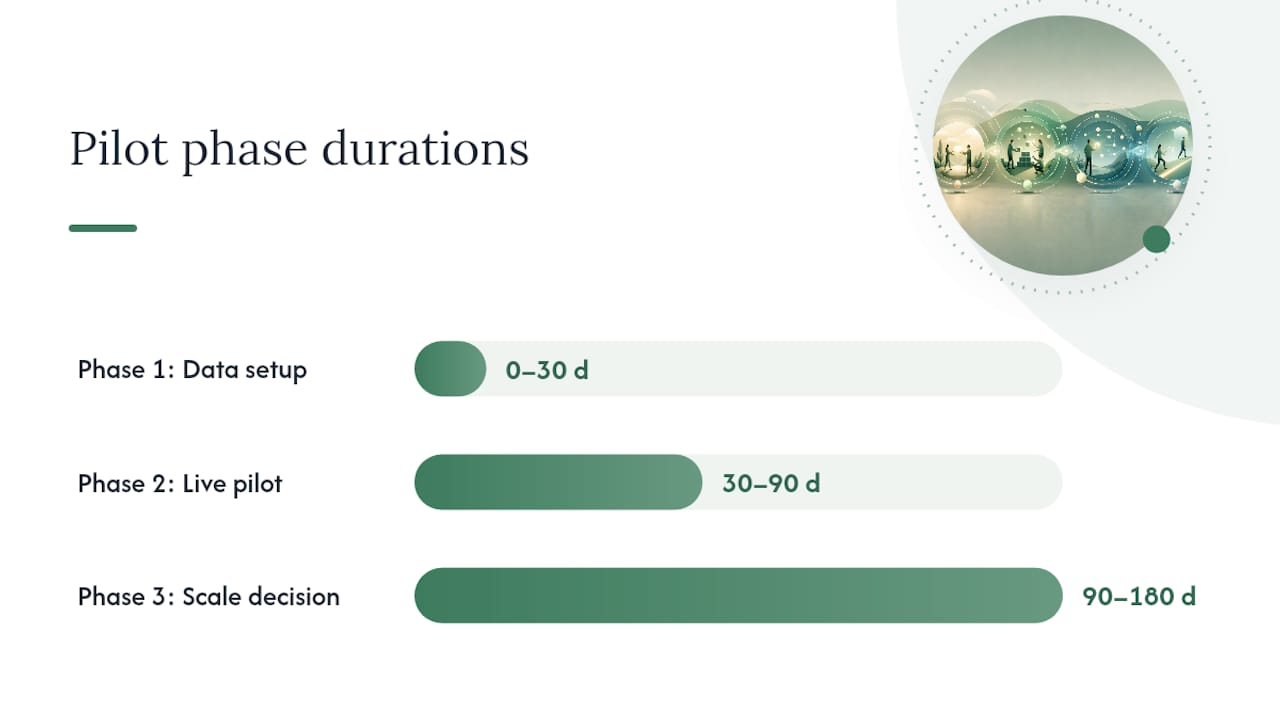
- Days 0 to 30: data readiness testing, connector setup, and a working proof-of-concept on historical data.
- Days 30 to 90: live pilot running on real-time or near-real-time data, with weekly reviews of false positives and missed signals.
- Days 90 to 180: scale-up decision based on whether the pilot hit its predefined success criteria, followed by expansion to a second KPI or business unit.
Your success criteria should be numeric and agreed upon before launch: a target reduction in MTTR, a specific drop in false alerts, or a defined time savings on manual reporting.
Pro Tip: Advanced ROI dashboards in many automation platforms stay locked until you’ve populated enough historical data to calculate a baseline, a good reminder that data maturity gates value, not the other way around, as UiPath’s own Insights documentation makes clear.
Should You Choose a Platform or Stitch Together Point Tools?
Favor an integrated platform when you need multiple data sources feeding one pipeline quickly; favor point tools when you have a single, narrow use case and an engineering team that enjoys building glue code. The tradeoff is speed versus control, and most teams underestimate how much time integration work eats once they’ve committed to a point-tool approach.
Four factors should drive the decision:
- Integration surface: how many APIs and connectors do you actually need, and does the platform already support them out of the box?
- Latency requirements: real-time alerting demands different infrastructure than a weekly batch report, and mismatching the two wastes engineering time.
- Governance and security: who can see what data, and can you audit every automated action after the fact?
- Scalability: will this pipeline still work when you add a fifth data source or a second business unit?
A technical evaluation checklist worth running before you commit to any vendor:
- Confirm data lineage tracking, so you can trace any output back to its source.
- Check model governance policies, especially how often models get retrained and by whom.
- Review the connector library against your actual data sources, not a generic feature list.
- Test the orchestration APIs directly rather than trusting a sales deck.
Analytics platforms built around visualizing operational metrics increasingly treat this as table stakes, and it’s worth pressure-testing any vendor claim against a real trial run rather than a demo environment.
What Does a Single-API Insights Platform Look Like in Practice?
A single-API platform cuts integration time dramatically because you connect once and gain access to dozens of intelligence tools instead of negotiating a separate integration for every data source. Prowl works this way for market and competitive intelligence: one connection to the Prowl MCP exposes 444 tools spanning SEO tracking, ad performance, pricing research, and review analysis.
A concrete flow looks like this: connect your agent to the data source through the API, request an automated report on a specific competitor or keyword set, schedule that report to run weekly, and set a follow-up action, like an alert if a competitor’s pricing shifts by more than a defined percentage.
Report-generation tools outside the market intelligence space follow a similar logic. Julius AI runs analysis code directly on uploaded data so the narrative and the charts in a report trace back to the same computation, which matters when a stakeholder asks “where did this number come from” and you need a real answer. Bricks and Tablize apply the same reproducibility principle with scheduling and threshold-based triggers layered on top.
When evaluating any vendor in this space, ask a short list of pointed questions:
- How many connectors are natively supported, and how many require custom integration work?
- What output formats does the platform support: PDF, interactive dashboard, PPTX, or something else your stakeholders actually use?
- Is pricing metered by usage or a flat subscription, and does that match your pilot’s expected volume?
- What’s the actual SLA on report freshness, not the marketing claim but the contractual guarantee?
What Goes Wrong With Insights Automation?
The single biggest recurring risk is poor data quality feeding an automated action, because automation doesn’t just miss the error, it amplifies it at scale before anyone notices. A bad manual report affects one meeting. A bad automated pipeline can send a hundred wrong alerts before someone catches the pattern.
Four pitfalls show up again and again, each with a specific fix:
- Data quality issues: missing or inconsistent data produces confident-sounding but wrong insights. Fix it by running data validation checks at ingestion, not after the model has already trained on bad inputs.
- Feedback bias: a model trained on its own automated decisions can reinforce whatever pattern it started with, even a flawed one. Fix it by periodically auditing outcomes against an independent, human-reviewed sample.
- Alert fatigue: too many notifications train people to ignore all of them, including the important ones. Fix it by tuning thresholds aggressively in the first 30 days and cutting any alert with a high false-positive rate.
- Over-automation: removing human review from high-stakes decisions too early creates liability and trust problems. Fix it by keeping a human checkpoint on any action with financial, safety, or legal consequences.
Pro Tip: Stage your automation in three tiers: alert only, alert plus recommended action, and full autonomous action. Most teams should live in tier two for months before trusting tier three, and some decisions, like anything touching customer refunds or safety thresholds, should probably never leave tier two at all.
How Should Teams Manage the Shift to Automated Insights?
Change management for insights automation succeeds or fails based on one factor more than any other: whether the people whose jobs touch the automated output were involved in defining what “good” looks like before launch. A pipeline that technically works but produces insights nobody trusts is a failed pilot, regardless of what the metrics say.
Start by naming an owner for each automated insight, not a committee. A single person accountable for a specific KPI will catch drift faster than a shared inbox ever will. Pair that owner with a short training session on how the automation actually works, not a black-box explanation, so they can explain a surprising result to their own team without escalating every question upward.
Run a shadow period where the automated insight generates but a human still makes the final call. This does two things: it builds trust in the system’s accuracy, and it surfaces edge cases the pilot didn’t anticipate. Only remove the human checkpoint once the shadow period shows consistent agreement between automated and manual judgment.
Communicate what’s changing and why in plain terms tied to the KPI, not the technology. “This will cut our average repair response time” lands better with a maintenance team than “we’re implementing a predictive analytics layer.”
Which KPIs Actually Prove Automated Insights Are Working?
Industry-specific KPIs give you a far more honest read on effectiveness than generic dashboard adoption metrics. A manufacturing floor cares about OEE and defect rate. A logistics operation cares about on-time delivery percentage and route deviation. A marketing team cares about conversion uplift and cost-per-acquisition trend, tracked automatically rather than pulled manually each week.
The pattern that matters: pick the KPI your industry already reports on manually, then measure whether automation improved the speed or accuracy of that same number. Don’t invent a new metric just because it’s easier to automate. If a factory already tracks MTTR by hand, the win is cutting that number down, not introducing an unrelated metric that looks good on a slide but doesn’t map to anything the floor supervisor already cares about.
Retail and e-commerce teams increasingly track automated pricing-response time, how quickly a system detects and reacts to a competitor’s price change, as a direct measure of insights automation effectiveness. Energy and utilities track automated demand-response accuracy, comparing predicted versus actual load shifts.
What Should You Compare Beyond Tools and Architecture?
Vendor evaluation for insights automation should weigh support quality, data governance maturity, and pricing transparency just as heavily as feature lists and technical architecture. Two platforms with nearly identical connector libraries can deliver wildly different outcomes based on how well they handle a support ticket when something breaks at 2 a.m.
Check whether the vendor publishes a real support and documentation hub versus a sales-gated help desk. Ask how the pricing model scales as your usage grows, metered credit systems behave very differently from flat subscriptions once you’re running dozens of automated reports a day. And look closely at how a vendor handles model retraining and versioning, because a platform that silently updates its underlying model without notice can quietly change your insight quality overnight.
Real-time notification quality is another underrated differentiator. Platforms built around real-time alerting treat the speed and relevance of a notification as a competitive feature, not an afterthought, and that distinction shows up fast once you’re running a live pilot instead of a demo.
What Legal and Ethical Issues Come With Automated Decision-Making?
Any automated action with financial, safety, or personal-data consequences carries legal exposure that a dashboard alone never did, because the system is now acting, not just informing. If an automated pricing rule discriminates against a customer segment, or a predictive maintenance model fails to flag a safety issue it should have caught, the automation itself becomes part of the liability chain.
Bias in AI models deserves specific attention here. A model trained on historical data inherits whatever bias existed in that history, and an automated action built on top of a biased insight scales the problem instead of catching it. Regular audits against an independent, representative data sample are the most practical safeguard, not a one-time model validation at launch.
Data privacy regulations vary significantly by jurisdiction, and automated pipelines that move personal data across borders or systems need governance controls appropriate to wherever that data originates and wherever it’s processed. This is general information, not legal advice: confirm your specific obligations with a qualified compliance professional or the relevant regulatory body before automating any pipeline that touches personal or regulated data.
Transparency matters too. If an automated system makes a decision that affects a customer or employee, being able to explain why, in plain language, is quickly becoming a baseline expectation rather than a nice-to-have.
When Does Insights Automation Actually Deliver Value?
The organizations that get the most out of insights automation share three traits: a KPI everyone already agrees matters, cross-functional ownership rather than one team hoarding the pipeline, and a culture that tolerates a few false positives during the tuning phase without abandoning the whole project.
The opposite pattern is just as predictable. If your data hygiene is inconsistent, if no single person owns the outcome, or if your team still can’t agree on which metric defines success, automating anything right now just automates the confusion faster. Fix those three things first. They cost nothing but attention, and skipping them is the single most common reason pilots stall.
For a well-scoped pilot with clean data and a motivated owner, expect a real signal within 60 to 90 days, enough to know whether to scale, and a meaningful return within two to three automation cycles after that, once the thresholds are tuned and the false-positive rate has settled.
Ready to Prototype Agent-Driven Reporting?
If you’re weighing whether to build custom connectors for every data source or stitch together point tools one integration at a time, there’s a faster path to a working pilot. Prowl connects your agent to 444 market-intelligence tools through a single API, so instead of spending weeks wiring up SEO trackers, ad performance feeds, and pricing scrapers separately, you request the report and get it back in one of several formats, PDF, interactive dashboard, PPTX, or infographic, without touching individual tool setups.

That single-connection approach is exactly the kind of shortcut this article has been describing: less integration overhead, more repeatable output, and a pilot you can stand up in days instead of a quarter. Browse real use cases across SEO, competitive analysis, and pricing research to see where teams like yours have started, then head to getting started to connect your agent and run your first automated report.
Sources
- Insights Hub | Siemens
- About Insights — UiPath Insights (Automation Suite)
- Observability, insights, and automation — IBM Developer
- Automation Insights — Balluff blog