
Competitor benchmarking is the repeatable, metric-based process of comparing your company’s performance against a defined set of peers to find gaps and prioritize what to fix. It works because it turns vague competitive anxiety into a ranked list of specific, measurable moves.
Here’s the 60-second version: pick one core KPI, say organic search traffic or Net Promoter Score, and pull your recent number against your relevant competitors’ equivalent figures. That single comparison is the minimum viable benchmark, and it’s enough to start prioritizing.
Do this consistently and the output looks like:
- A short list of one to three improvement opportunities, each tied to a measurable KPI
- A clear next experiment or budget request to close the gap
- A baseline you can revisit next quarter to check if the fix worked
Groups like APQC and Qualtrics have spent years refining this methodology for enterprise teams. Platforms like Prowl now let analysts automate the data pull so the comparison takes minutes instead of a week of manual research.
Key Takeaways
Competitor benchmarking works when a defined competitive set, consistent metrics, and normalized data feed directly into a prioritized, owned action plan.
| Point | Details |
|---|---|
| Start with a question | Define what success looks like before collecting a single data point. |
| Build a mixed competitive set | Blend direct rivals, disruptors, and category leaders for more actionable insight. |
| Normalize before comparing | Match figures by per-user, per-location, or per-segment basis to keep comparisons valid. |
| Pair numbers with context | Use qualitative insight to explain why a metric gap exists, not just that it exists. |
| Automate the repeat work | Prowl connects benchmarking data sources through one API to keep programs running continuously. |
Table of Contents
- What Is Competitor Benchmarking, Exactly?
- What Types of Benchmarking Should You Run?
- How Do You Run a Competitor Benchmarking Project?
- Which Metrics Matter Most in a Benchmarking Program?
- Where Do You Find Reliable Competitor Data?
- What Mistakes Undermine Benchmarking Results?
- How Do You Scale Benchmarking With Automation?
- What I’ve Learned Running Benchmarking Programs
- Automate the Parts of Benchmarking That Don’t Need a Human
- Frequently Asked Questions
- Sources
What Is Competitor Benchmarking, Exactly?
For analysts, competitor benchmarking means a repeatable, metric-based comparison against peers over time, built specifically to surface performance gaps and their root causes. That’s a different discipline from competitive analysis, and the distinction matters more than most teams treat it.
Competitive analysis is a snapshot: what does this rival’s pricing page say today? Benchmarking is a system: how has our conversion rate tracked against theirs for the last four quarters, and why did the gap widen in Q2?
One is tactical and occasional. The other is ongoing and quantitative, run on a schedule with the same metrics measured the same way every time. You can’t benchmark off a single competitor teardown any more than you can judge fitness from one blood pressure reading.
Analysts typically apply competitor benchmarking to:
- Tracking market share shifts across a category over multiple quarters
- Evaluating whether a marketing campaign outperformed the competitive set, not just last year’s number
- Comparing product performance (feature adoption, churn, return rates) against rivals
- Diagnosing operational or process inefficiencies relative to industry leaders
- Feeding hard numbers into annual strategic planning cycles
The output of benchmarking should always be a decision, not a dashboard.
What Types of Benchmarking Should You Run?
Qualtrics splits competitive benchmarking into three core types, and knowing which one you’re running keeps a project from drifting into busywork.
Performance benchmarking compares hard numbers: revenue growth, website traffic, conversion rates. If your board wants to know whether you’re gaining or losing share, this is the type to run.
Strategic benchmarking looks at business model and market positioning rather than raw metrics.
Process benchmarking examines operational efficiency, things like fulfillment speed or support ticket resolution time. Interestingly, APQC finds that for functions like payroll or procurement, benchmarking against a process leader in a completely different industry often surfaces more usable ideas than benchmarking your direct rival.
Layer in the internal versus external axis: internal benchmarking compares your own business units or regions against each other, while external benchmarking looks outward. Most mature programs run performance metrics to spot where gaps exist, then use process benchmarking to figure out why.
How Do You Run a Competitor Benchmarking Project?
A benchmarking project without a defined question turns into a data-collection exercise nobody acts on. SurveyMonkey’s framework and the steps below give you a structure that ends in action, not just a spreadsheet.
-
Define the business question first. What does success look like? “Are we losing organic visibility to Competitor X” is a real question. “How are we doing compared to competitors” is not.
-
Build a relevant competitive set. Resist the urge to benchmark only against the biggest name in your space. Launchmetrics recommends mixing direct rivals, emerging disruptors, and category leaders, since disruptors often reveal where the market is heading before the incumbents do.
-
Choose a focused metric set and normalization rules. Five metrics measured consistently beat twenty measured loosely. Decide upfront whether you’re comparing per-user, per-location, or per-segment figures, because raw totals between a company with 50 employees and one with 5,000 tell you nothing useful.
-
Collect and validate data. Assign a confidence score to each data point (public filing versus scraped estimate versus survey response) and cross-check anything that looks like an outlier before it enters your report.
-
Analyze, prioritize, and monitor. Plot findings on an impact-versus-effort matrix, assign an owner to each prioritized action, and set a review cadence, monthly for fast-moving digital metrics, quarterly for strategic ones.
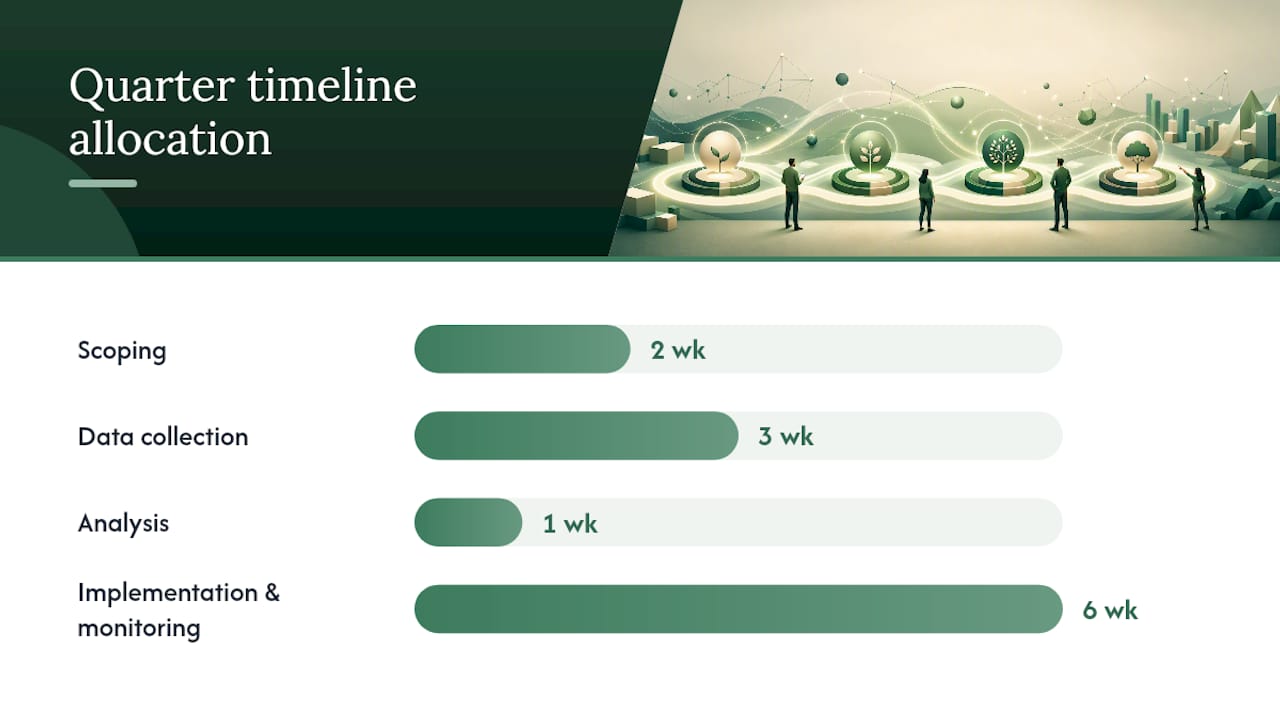
A simple quarter-long timeline: weeks 1 to 2 for scoping and competitive-set selection, weeks 3 to 5 for data collection, week 6 for analysis and the impact/effort matrix, weeks 7 to 12 for implementation and monitoring against the baseline you set in week 1.
Pro Tip: Build your action plan template before you start collecting data, not after. If you don’t have a column for “owner” and “review date” ready to fill in, the findings will sit in a slide deck instead of turning into a shipped fix.
Strategic frameworks like SWOT and PESTLE pair well with strategic benchmarking specifically. They help you interpret why a competitor’s positioning works before you decide whether to copy or counter it.
Which Metrics Matter Most in a Benchmarking Program?
Group your metrics into buckets instead of tracking everything at once, or you’ll drown in numbers that don’t connect to a decision.
Market and financial metrics: market share, revenue growth rate, and for software companies, the metrics investors actually scrutinize, like net revenue retention and CAC payback, which Othrfund’s guide to SaaS funding metrics breaks down well for benchmarking against funding-stage peers.
Customer and experience metrics: Net Promoter Score, customer satisfaction (CSAT), and retention rate. Normalize these by customer segment. Comparing enterprise NPS to self-serve NPS across two companies with different customer mixes will mislead you every time.
Digital metrics: organic traffic, paid media share, and keyword rankings. Similarweb recommends comparing website ranking, channel distribution, and engagement side by side to expose exactly where a traffic gap originates.
Social and share of voice: mention volume, engagement rate, and sentiment, ideally normalized per post rather than as raw totals.
Pricing and product performance: feature adoption rates, return rates, and price positioning relative to the competitive set.
A useful executive dashboard puts one metric from each bucket on a single page: market share, NPS, organic traffic trend, and share of voice, refreshed monthly.
Pro Tip: Never report a raw number without its normalization basis attached. “40,000 monthly visits” means something completely different for a company with 2 employees versus 200.
Where Do You Find Reliable Competitor Data?
Data quality determines whether your benchmarking conclusions survive contact with a skeptical VP. Match the source to the metric instead of grabbing whatever’s easiest to pull.

| Metric type | Practical data source | Typical confidence |
|---|---|---|
| Market share, revenue | Public filings, market research reports | High for public companies, moderate for estimates |
| Digital traffic, SEO | Web analytics suites, SEO platforms | Moderate to high with cross-tool validation |
| Customer sentiment | Surveys, review sites, social listening | Moderate, depends on sample size |
| Pricing, product features | Mystery shopping, public pricing pages | High, but requires manual refresh |
| Brand perception | Survey panels, social listening tools | Moderate |
Cross-check any single-source number against a second source before it goes into a report. Launchmetrics makes the point well: measure every competitor with the identical methodology, and always contextualize the result by what actually drove it, a paid campaign, an earned-media spike, an influencer partnership, rather than treating the raw number as the full story.
Pro Tip: Keep a running log of which source you used for each data point. Six months from now, when a number looks off, you’ll want to know if it came from a scraped estimate or an audited filing.
What Mistakes Undermine Benchmarking Results?
The fastest way to waste a benchmarking budget is skipping the purpose step, comparing unnormalized numbers, or reading a single snapshot as if it were a trend.
Watch for these red flags before you trust a comparison:
- A competitor’s number spiked around a single event (a product launch, a viral post) rather than reflecting steady performance
- Sample sizes too small to support a confident conclusion, especially in survey-based metrics
- Seasonal effects skewing a quarter-over-quarter comparison without accounting for the calendar
Best practices to counter this:
- Write down the business question before pulling any data
- Choose a competitive set that’s genuinely comparable, not just convenient
- Normalize every figure by the same basis across the set
- Pair the quantitative comparison with qualitative context, APQC notes that leaders use benchmarking to understand the “why” behind a gap, not just the “what”
- Assign an owner and a deadline to every action item that comes out of the analysis
How Do You Scale Benchmarking With Automation?
Manual benchmarking works for one project. It falls apart when you need it running continuously across ten metrics and five competitors. That’s where an automated pattern earns its keep: automated data collection, a standardized metrics library, anomaly detection, human review of what the anomalies mean, then action.
Before automating, confirm you have:
- Data connectors for each source you rely on (analytics, SEO, social listening)
- Documented normalization rules so the system compares apples to apples
- A scheduled run cadence with alerts when a metric moves past a threshold
- A report template that turns raw output into something a stakeholder can act on
Done right, automation catches a competitor’s traffic surge within days instead of at next quarter’s review. The caveat APQC’s research implies still applies: automation amplifies bad data as fast as good data, so a human still needs to sanity-check what the system flags. A connector platform like Prowl exists precisely to reduce the setup burden across that many tools at once.
What I’ve Learned Running Benchmarking Programs
The benchmarking projects that actually moved a KPI weren’t the ones with the fanciest dashboard. They were the ones where someone asked “why is our competitor’s number different” and dug into the answer instead of just reporting the gap.
One pattern I’d flag: teams that copy a competitor’s exact tactic almost always underperform teams that adapt the underlying insight to their own customer base. A pricing structure that works for a competitor with a different customer mix rarely transplants cleanly. Learn the principle, not the playbook.
Automate the Parts of Benchmarking That Don’t Need a Human
Everything above works whether you do it by hand or with software, but the manual version eats a week of analyst time every time you refresh it. That’s the real cost most teams underestimate: not the first benchmarking report, but the fifth one, run three months later, when nobody has bandwidth to repeat the data pull.

Prowl connects your agents to 444 market-intelligence tools through a single API, so a benchmarking refresh that used to take days of manual pulls across SEO tools, social listening, and analytics platforms runs as one automated workflow. A few things it handles directly:
- Pulls competitor SEO, ad performance, and traffic data through one connector instead of five separate logins
- Generates standardized reports (interactive dashboards, PDFs, PPTX) so findings are ready to present without a rebuild
- Runs on a schedule, so your quarterly benchmark becomes a continuous one
If you’re running a benchmarking program right now and dreading the next manual refresh, the Getting Started guide walks through connecting your first agent in a few minutes.
Frequently Asked Questions
How often should you run a competitor benchmarking cycle? Digital metrics like traffic and social engagement benefit from monthly checks. Strategic and process benchmarking, which move slower, typically work best on a quarterly or annual cadence.
How many competitors should be in a benchmarking set? Three to five is usually enough for a focused project. Launchmetrics recommends mixing direct rivals with emerging disruptors rather than only tracking the market leader.
What’s the difference between competitor benchmarking and competitive analysis? Competitive analysis is a one-time, tactical snapshot. Competitor benchmarking is a repeatable, metric-driven comparison run on a schedule to track change over time.
Can small teams run competitor benchmarking without expensive tools? Yes. Start with one KPI, free analytics data, and public competitor information. Add paid tools or automation once the manual process proves valuable enough to repeat.
How do you communicate benchmarking findings to executives? Lead with the prioritized action, not the raw data. A one-page summary showing the gap, its likely cause, and the proposed fix gets more attention than a full metrics dump.
Sources
- How to Benchmark Against Competitors | APQC
- Competitive Benchmarking: Best Practice Guide - Qualtrics
- Competitive Benchmarking: How To Boost Your Market Position
- How to use competitive benchmarking for market research | SurveyMonkey