
A churn prediction model outputs a risk score or a time-to-churn estimate for each customer, ranking who is likely to leave and roughly when. The right first move is not picking the fanciest algorithm. It’s confirming your churn definition, checking whether your data actually supports labeling, and starting with an interpretable model plus disciplined feature engineering before you touch anything more complex.
TL;DR:
- Accurately defining churn types, such as voluntary versus involuntary or subscription versus non-subscription, is crucial for selecting appropriate features and models.
- Starting with basic, well-engineered features like recency, frequency, and billing signals often yields more predictive power than complex, exotic features.
- Choose simple models like logistic regression or tree-based ensembles that match your data volume, interpretability needs, and engineering capacity before moving to neural or hybrid architectures.
- Address class imbalance by resampling only training data, applying class weighting, or adjusting decision thresholds, avoiding synthetic techniques on evaluation sets.
- Set clear intervention actions based on risk bands and driver explanations, and continually monitor model performance, calibration, and drift to maintain effectiveness over time.
Table of Contents
- What Churn Prediction Models Actually Need You to Define First
- Data Requirements and Labeling: What You Need Before You Model Anything
- The Signals That Actually Move the Needle
- Choosing a Model Family: Match the Tool to the Constraint
- Handling Class Imbalance Without Fooling Yourself
- Evaluation Metrics That Match the Business Question
- Turning Scores Into Reasons: Why Explainability Isn’t Optional
- From Risk Score to Retention Action
- A Reproducible End-to-End Workflow
- Deployment, Monitoring, and Keeping the Model Honest
- The Mistakes That Waste the Most Time
- Speed Up the Research Behind Your Churn Model
- Sources
What Churn Prediction Models Actually Need You to Define First
Before you write a line of modeling code, you need to pin down what “churn” means for your business, because a fuzzy definition wrecks everything downstream. Get this wrong and your labels are noise, your evaluation metrics lie to you, and your interventions target the wrong people.
Churn splits into a few distinct flavors, and mixing them up is one of the most common early mistakes:
- Voluntary vs. involuntary churn: a customer canceling on purpose versus a failed credit card payment silently ending the relationship. These need different features and often different models entirely.
- Subscription vs. non-subscription churn: subscription businesses get a clean cancellation event; non-subscription (retail, marketplaces) requires an inactivity threshold to infer churn.
- Account-level vs. user-level: in B2B, one seat going dark doesn’t mean the account churned. Decide which unit you’re actually predicting.
The definition you choose shapes your labeling window, your evaluation approach, and what an “intervention” even looks like. A support team can’t act on a churn definition that only makes sense to a data scientist.
Data Requirements and Labeling: What You Need Before You Model Anything
Most churn projects fail before modeling starts, because the underlying data isn’t ready. Microsoft Fabric’s churn prediction tutorial lays out a useful baseline: a stable customer identifier, subscription or transaction history, and at least two activity records for roughly half your target customers. If you can’t clear that bar, fix your instrumentation before you fix your model.
Run through this checklist before training anything:
- Confirm core fields exist: customer ID, timestamps for every event, subscription or transaction status, billing history, and support ticket logs.
- Check completeness: key fields should have under 20% missingness. Anything worse needs a data-quality fix, not an imputation hack.
- Pick your churn window deliberately. Dataiku’s guidance on this is blunt: too long a window dilutes the signal, too short a window and you can’t measure whether an intervention worked. Align it to your actual retention cadence, whether that’s 30 days or a full billing cycle.
- Use time-aware splits. Train on data up to time T, validate on data after T. A random shuffle split will leak future information into your training set and inflate your metrics.
- Run a leakage audit: any feature computed after the churn event, or any feature that only exists because a customer already left, gets dropped.
- Verify joins: sample 50 to 100 customer records manually and trace them through every table. Broken joins are the single most common source of silent modeling failure.
Skipping this step doesn’t save time. It just moves the failure from week one to week six, after you’ve already built the model.
The Signals That Actually Move the Needle
Most of the predictive power in a churn model comes from a small set of signal categories, not exotic feature engineering. Amplitude’s overview of churn prediction repeatedly points back to the same core group: recency, frequency, tenure, billing events, and support interactions. Get these right before you chase anything more elaborate.
Start with a shortlist you can build in a week:
- Recency: days since last login, last purchase, last support contact.
- Frequency: session count or transaction count over trailing 7, 30, and 90 day windows.
- Tenure: account age, and whether the customer is inside or outside a typical churn-risk window for their cohort.
- Billing signals: failed payments, downgrade events, discount usage, days until renewal.
- Feature adoption: breadth of product usage relative to what a healthy customer at that tenure normally uses.
The real engineering work happens in how you transform raw events into these numbers. Rolling-window aggregates (7 day vs. 30 day activity) catch acceleration or deceleration in engagement that a single snapshot misses. Deltas and rates, this week’s activity minus last week’s, matter more than absolute levels because they surface change. Cohort-relative metrics, comparing a customer against others at the same tenure, correct for the fact that a 2-year-old account and a 2-month-old account have wildly different “normal” usage baselines.
Sparse events (a feature used once a quarter) and high-cardinality categoricals (hundreds of product SKUs) both need deliberate handling: bucket rare categories, and consider frequency-encoding or embeddings rather than naive one-hot encoding once cardinality gets past a few dozen values.

Pro Tip: Build your first feature set from just five signals: days since last activity, 30-day session count trend, tenure in months, failed payment count in the last 90 days, and feature-adoption breadth. That handful, cleanly engineered, usually beats a sloppy 200-feature dump.
Choosing a Model Family: Match the Tool to the Constraint
Algorithm choice matters less than most people think, at least at first. What matters is matching the model to your data volume, your need for interpretability, and how much engineering time you actually have.
- Logistic regression is the right starting point when you have a modest, well-engineered feature set and need coefficients you can explain to a VP in one sentence. It’s fast to train, fast to retrain, and forces you to think hard about feature quality since it can’t paper over noise with complexity.
- Tree ensembles and gradient boosting (random forest, LightGBM) tend to win when your data mixes numeric and categorical features with nonlinear interactions, which describes most real churn datasets. LightGBM in particular handles large feature sets and missing values gracefully, and it’s become close to a default choice among practitioners for this reason.
- Neural networks and hybrid architectures earn their complexity only at real scale, or when sequence patterns matter more than snapshot features. A hybrid model called CCP-Net, combining attention, BiLSTM, and CNN components, reported 1 to 3 percent improvements in precision and F1 over strong baselines across telecom, banking, insurance, and news datasets. That’s a real gain, but it comes with a real interpretability and engineering cost.
- Survival analysis answers a different question entirely: not just who will churn, but when. If your retention team needs to prioritize based on urgency, not just probability, survival models pair well with a classification score to answer “who is at risk now versus who is at risk in six months.”
A logistic regression with ten well-engineered features frequently delivers faster ROI than an opaque model with a marginally better AUC, because your team can actually act on what it explains.
Handling Class Imbalance Without Fooling Yourself
Churn is almost always a minority-class problem, often 5 to 15 percent of customers in a given window, and that imbalance breaks naive model training if you don’t correct for it.
- Resample only the training folds. SMOTE, ADASYN, or simple oversampling should never touch your test set. Microsoft’s Fabric tutorial is explicit on this point: apply SMOTE to training data only and leave the test set exactly as observed, so your evaluation reflects reality, not synthetic patterns.
- Try class weighting before synthetic sampling. It’s simpler, avoids generating fake data points, and works well with logistic regression and most gradient boosting libraries out of the box.
- Adjust the decision threshold rather than always reaching for resampling. Sometimes the fix is just moving the cutoff from 0.5 to something that matches your actual base rate.
- Watch for overfitting to synthetic patterns. If a resampled model’s validation performance looks too good, check whether SMOTE created unrealistic feature combinations that don’t exist in your real customer base.
- For small datasets, favor interpretable rules over aggressive resampling. A simple recency-frequency rule can outperform a complex resampled model when you have only a few thousand customers to work with. The fraud detection field deals with even more extreme imbalance and reaches the same conclusion: simple, well-calibrated rules often beat complex resampling on small, noisy datasets.
Evaluation Metrics That Match the Business Question
The metric you optimize for should reflect how you’re actually going to act on the model, not just which number looks best in a slide deck.
- Precision matters most when your intervention budget is tight; you can’t afford to waste retention offers on customers who weren’t leaving anyway.
- Recall matters most when missing a churner is expensive relative to the cost of a false positive, common in high-LTV B2B accounts.
- AUPRC (area under the precision-recall curve) is the right headline metric for imbalanced churn problems. Plain AUC can look deceptively strong even when precision at your actual operating threshold is poor.
- Calibration checks matter because a model that ranks customers correctly but assigns wildly inaccurate probabilities will mislead any team trying to size an intervention budget off the raw scores.
Time-based validation isn’t optional here. A rolling-window backtest, train on months 1 through 10, test on month 11, then roll forward, catches seasonal drift and behavior shifts that a random k-fold split will completely miss.
Survival models need their own read: instead of a single accuracy number, you’re looking at hazard curves and concordance indexes that tell you how well the model ranks customers by time to churn, not just likelihood.
Turning Scores Into Reasons: Why Explainability Isn’t Optional
A risk score with no explanation is close too useless to a support or product team. They need to know why a customer is flagged before they can decide what to do about it.
- Use SHAP for both per-customer explanations (why is this account at 87% risk?) and global feature attribution (which signals drive risk across the whole portfolio). One practitioner study on explainability treats SHAP or LIME as close to a requirement for converting churn scores into decisions business teams will actually trust and act on.
- Build short explanation cards, not raw SHAP plots, for support and product teams: three bullet points on why an account is flagged and one recommended next step beats a force plot nobody outside the data team can read.
- Record explanation snapshots alongside model versions. When someone asks six months later why a specific account was flagged, you need to reproduce that exact explanation, not just the score.
Pro Tip: If SHAP flags “failed payment in the last 30 days” plus “adoption below cohort average” as the top two drivers for a customer, don’t send a generic discount. Route that account to billing support first, then follow up with a feature-adoption nudge. Match the intervention to the actual driver, not the score.
From Risk Score to Retention Action
A model output only becomes useful once it drives a specific action, and that means building a bridge between the score and your retention playbook.
- Set risk bands, not just a single cutoff. Split into high, medium, and low risk, and map each band to an intervention tier your team can actually staff. A high-risk, high-LTV account might warrant a phone call; a medium-risk, low-LTV account might just get an automated email.
- Layer in uplift modeling where intervention costs are meaningful. A plain risk score tells you who’s likely to leave, not who would actually respond to an offer. Uplift models isolate the second group, and Dataiku’s guidance on this is clear that pairing the two prevents wasting budget on customers who would have stayed regardless.
- Match the intervention to the driver, not just the risk level. Failed-payment churn needs a billing fix. Low-adoption churn needs onboarding help. A generic discount offer thrown at every flagged account wastes money on the wrong problem.
- Design proper A/B tests around interventions, holding out a control group of similarly-scored customers who receive no outreach, so you can measure incremental retention lift and actual ROI rather than just watching whether flagged customers stuck around anyway.
Predictive analytics earns its budget here: catching early warning signs like declining engagement or a run of negative support tickets lets teams intervene before a customer has mentally checked out, and retaining an existing customer is almost always cheaper than replacing them.
A Reproducible End-to-End Workflow
You don’t need a research paper’s worth of infrastructure to get a working churn model into production. You need a disciplined sequence, tracked and repeatable.
Pre-model checklist:
- Finalize your churn definition and prediction window.
- Verify joins across customer, billing, and activity tables on a 50 to 100 record sample.
- Confirm sample counts meet minimum thresholds for your target class.
Experimentation steps:
- Train a baseline logistic regression on your core five to ten features. Log the run.
- Move to a tree ensemble or LightGBM once the baseline is stable. Compare AUPRC, not just accuracy.
- Only attempt neural or hybrid architectures if the ensemble result is insufficient and you have the data volume and engineering time to support it.
- Track every run’s hyperparameters, feature set, and evaluation scores in a shared log, not a personal notebook.
Deployment checklist:
- Decide scoring frequency (weekly is typical for most subscription businesses).
- Stand up a monitoring dashboard tracking prediction distribution and feature drift.
- Set retraining triggers. Microsoft’s Fabric tutorial recommends monthly retraining for many businesses, with earlier retraining if drift alerts fire.
- Report segmented lift and intervention ROI to stakeholders, not raw model accuracy. Nobody in a leadership meeting cares about your AUPRC. They care whether the retention campaign paid for itself.
Deployment, Monitoring, and Keeping the Model Honest
A churn model that worked at launch degrades quietly if nobody’s watching. Customer behavior shifts, pricing changes, and new product features all move the ground under a model’s feet.
- Track population drift: is the customer base you’re scoring today the same shape as the one you trained on?
- Watch calibration drift: even if ranking stays accurate, predicted probabilities can drift away from actual outcomes over time.
- Monitor intervention effectiveness separately from model accuracy. A model can still rank customers correctly while your retention offers stop working, and that’s a business problem the model itself won’t flag.
- Validate before every rollout. Never push a retrained model to production without comparing it against the current model on a held-out recent window.
- Assign a clear score owner, someone accountable for the model’s health, not just its initial build. This practitioner’s guide to edge-case failures makes the broader point well: most production ML failures come from unmonitored drift, not from a bad initial model.
The Mistakes That Waste the Most Time
Most churn projects don’t fail because the model is bad. They fail because the team spends three weeks chasing a 0.5 percent AUPRC improvement that nobody downstream can act on, while a genuinely useful signal, like a spike in failed payments, sits unused in a table nobody joined.
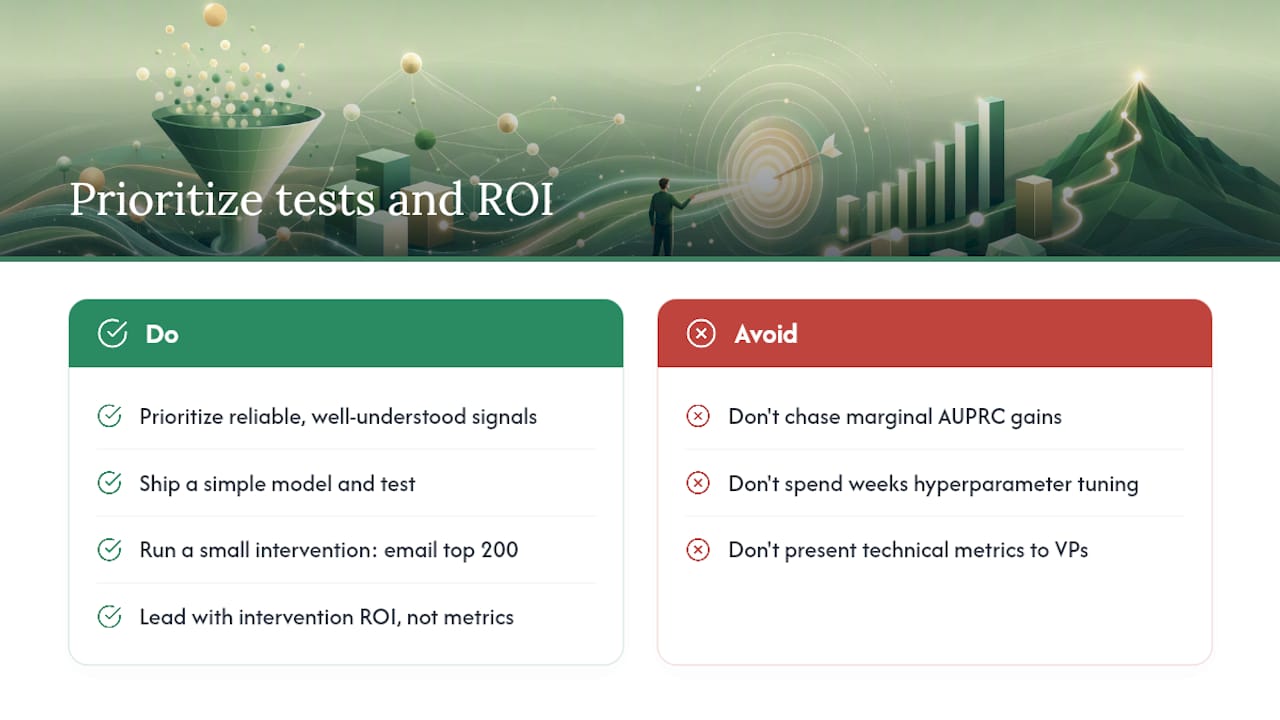
Prioritize reliable, well-understood signals over marginal model gains early on. Ship a simple model against a small, real intervention (an email to your top 200 risk scores) before you’ve perfected the algorithm. That single test tells you more about whether your churn definition and features are sound than another week of hyperparameter tuning ever will.
When you present results to stakeholders, lead with the intervention ROI, not the model’s technical metrics. A VP doesn’t need to hear about AUPRC. They need to hear that a $2,000 retention campaign, targeted using the model’s top decile, saved $40,000 in projected lifetime revenue. That’s the number that gets you resources for the next iteration.
— Sergey
Speed Up the Research Behind Your Churn Model
Building the churn model is half the job. The other half is the research that feeds it: benchmarking which signals competitors track, pulling billing and usage patterns from public sources, and turning model output into a report a VP will actually read. That’s slow work when it’s manual, and it’s exactly where Prowl fits in.

Prowl connects any agent or workflow to 444 market-intelligence tools through one MCP, so instead of stitching together separate research tools to benchmark signals or draft a stakeholder report, you run it through one connector. Teams use Prowl to accelerate the discovery work around a churn project, competitive benchmarking, usage-pattern research, pricing comparisons, and to generate the interactive reports and PPTX decks that turn a risk score into something a retention team will act on. It’s not a replacement for your modeling pipeline; it’s the layer that speeds up everything around it. If your team is spending more time compiling research than building features, check out Prowl’s use cases or get started connecting it to your agent.
Sources
- Tutorial: Create, evaluate, and score a churn prediction model - Microsoft Fabric | Microsoft Learn
- What Is Churn Prediction: Complete Guide
- How to address churn with predictive analytics
- Explainability and interpretability practices in applied ML (practitioner study)