
Every agency needs four core report templates in rotation: monthly retainer, campaign performance, project status, and quarterly business review. Deliver them as PDFs for finance-minded clients, slide decks for marketing stakeholders, or live dashboards for hands-on partners who want to poke at the numbers themselves.
TL;DR:
- Most agency reports should follow a standard structure, including an executive summary, KPI snapshot, results versus goals, and next steps.
- Templates should be tailored to the audience, with slide decks for live presentations, PDFs for email updates, and dashboards for real-time access.
- Automating data pulls from sources like Google Analytics and ad platforms reduces manual work to about 20-30% and improves report accuracy.
- Build and standardize one master template per report type and service line before scaling automation to prevent chaos and maintain consistency.
- Using tools like Prowl connects templates directly to live data, freeing up account teams to focus on analysis and client insights rather than data collection.
Table of Contents
- Which Agency Report Templates and Formats Actually Work
- The Section-by-Section Anatomy Every Template Needs
- Copy-Ready Checklists for Each Report Type
- How to Automate the Data Pull Without Losing the Narrative
- How Prowl Fits Into a Template-First Workflow
- Standardize First, Automate Second
- Put Your Reporting on Autopilot
- Where to Find Templates and Reporting Guides
- Sources
Which Agency Report Templates and Formats Actually Work
Not every client needs the same document, and pretending otherwise is how agencies end up rebuilding reports from scratch every month. Each template family exists because it answers a different question, for a different person.
The monthly retainer report answers “are we still getting our money’s worth?” It goes to the day-to-day marketing contact and covers the full scope of ongoing work. The campaign performance report answers a narrower question, “did this specific push work?”, and usually lands right after a campaign wraps. The project status report is operational, meant for internal stakeholders and project sponsors who care about timelines and blockers more than ROI. The quarterly business review (QBR) is the big one: a strategic look-back for executives and budget holders who want to see the story across three months, not one.
Format follows audience, not habit. A few rules of thumb:
- Slide decks work best for QBRs and any report presented live, since they force you to sequence the story instead of dumping data.
- PDFs suit monthly retainer reports sent by email to clients who skim rather than dig.
- Live dashboards fit hands-on clients or larger retainers where real-time access reduces the “can you pull last week’s numbers” emails.
- Single-page email summaries work for smaller accounts where a full deck would be overkill.
- Spreadsheet templates cover budget/hours tracking and any report a finance contact will want to manipulate.
Keep source files editable. A Google Slides or PowerPoint master lets account leads swap logos and metrics without rebuilding layouts, and platforms like Canva’s report templates and Venngage both offer pre-built, chart-ready layouts if you’re standing up your first template library. Word’s built-in Copilot drafting tools can also turn a pile of screenshots and notes into a rough draft summary, which is useful when someone on the account team is buried and needs a head start.
The Section-by-Section Anatomy Every Template Needs
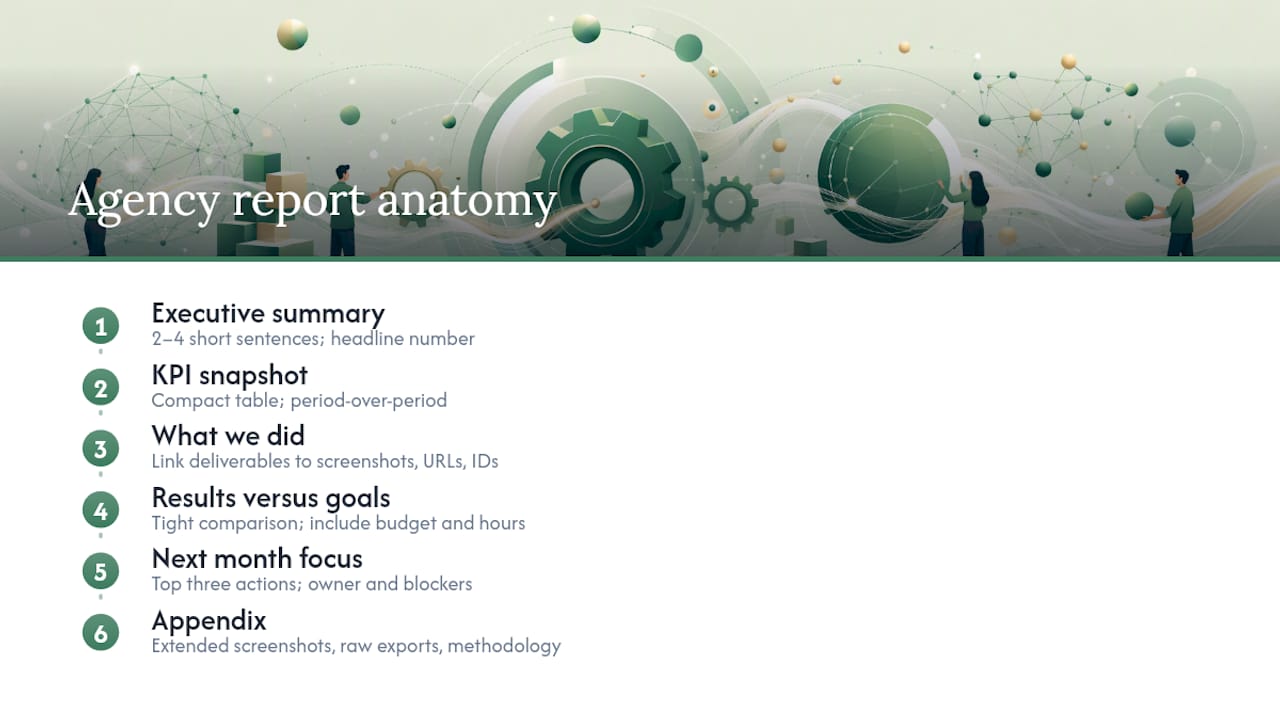
Strip away branding and industry jargon, and every good agency report follows the same skeleton. Build this once, apply it everywhere.
The executive summary comes first, and it should stay short: two to four sentences covering the headline result, the biggest risk or open question, and a single clear ask if there is one. This is the section clients actually read, so front load it with the number that matters most instead of burying it under a paragraph of context.
The KPI snapshot follows immediately, usually as a compact table with period-over-period comparisons rather than a wall of numbers.
After the snapshot, the report needs a “what we did” section that links specific deliverables (ad creative, landing pages, published posts) to evidence: screenshots, live URLs, campaign IDs. Skipping this is the fastest way to make clients wonder what they’re actually paying for.
Next comes results versus goals, presented as a tight comparison rather than a repeat of the KPI table, plus budget and hours burned if the retainer structure calls for it. Close with a next month focus naming the top three actions, who owns each one, and any dependency blocking progress.
Anything that doesn’t fit those sections, extended screenshots, raw exports, methodology notes, belongs in an appendix, not the main body.
Pro Tip: Write the executive summary last, even though it appears first. You’ll write a sharper two sentences once you’ve already built the KPI table and know which number actually tells the story.
Copy-Ready Checklists for Each Report Type
Templates only save time if the team actually reuses them instead of rebuilding structure every cycle. Here’s what each report type needs, with realistic production guidance.
- Monthly retainer report. Aim for 6 to 10 pages and 90 to 180 minutes of production time once automation handles the data pull. Core KPIs, executive summary, wins and challenges, and next month focus are non-negotiable; everything else is optional padding.
- Campaign performance report. Structure it around the objective, total spend, headline result, what worked, what didn’t, and a clear recommendation for the next campaign. Keep it to a page or two; campaign reports get read once, right after launch, and rarely again.
- Project status report. One page, RAG format (red, amber, green), with named owners next to each blocker. Atlassian’s project reporting guidance backs this up: status reports should stay short, standardized, and built around timelines rather than narrative.
- QBR. Slide order matters here more than any other format: open with the quarter’s headline result, move through channel performance, then strategy for next quarter, and close with an appendix of supporting detail for anyone who wants to dig deeper. Run this cadence at months 3, 6, 9, and 12 so it aligns with budget cycles rather than arbitrary calendar quarters.
A few things apply across all four:
- Never mix report types in one document. A monthly report that tries to also be a QBR satisfies neither audience.
- Keep a single master template per report type per service line, and only allow small client-specific variables (logo, color, contact name) rather than open-ended customization.
- Cap the time spent on any one report at roughly 4% to 6% of that client’s monthly retainer value, based on agency reporting benchmarks, so reporting overhead doesn’t quietly eat your margin.
How to Automate the Data Pull Without Losing the Narrative
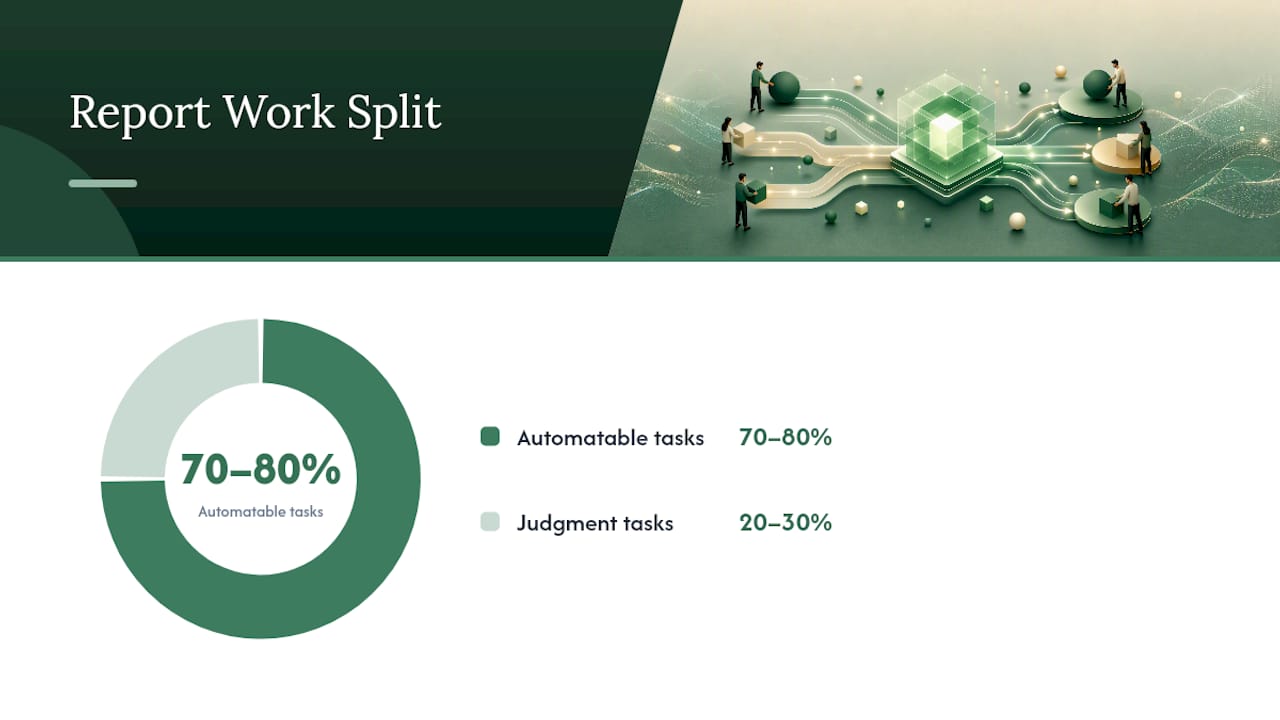
The math that makes agency reporting sustainable is simple: automate the 70% to 80% that’s just numbers and screenshots, and spend your actual time on the 20% to 30% that requires judgment, according to the same agency client reporting guide. Most agencies get this backwards. They spend hours copying metrics into slides and then rush the one paragraph that explains why performance moved.
The usual data sources are predictable: GA4 for site behavior, ad platform dashboards (Google Ads, Meta, LinkedIn) for spend and conversions, Search Console for organic visibility, and time-tracking or billing software for hours and budget burn. Pulling these manually every month is exactly the kind of repetitive task that eats junior account staff’s week. Normalizing them through an API or ETL layer, or a connector that pulls from multiple platforms at once, turns that week into an afternoon.
Delivery patterns matter almost as much as the pull itself:
- Schedule automatic PDF exports for clients who just want a document in their inbox on the same day each month.
- Use a live dashboard link for clients who check in more often than monthly.
- Export slide decks for anything presented live, like a QBR.
- Set version control and access permissions so old drafts don’t circulate by accident.
Before anything goes out, run a short QA pass: confirm period labels match the reporting window, tag each data source so anomalies are traceable, name who owns the report, and get a second set of eyes before it hits a client inbox.
Pro Tip: If your team keeps catching wrong date ranges after a report is sent, the fix usually isn’t more careful proofreading. It’s a template where the period label pulls automatically from the data source instead of getting typed in by hand.
How Prowl Fits Into a Template-First Workflow
Automation only works if the connection to your data sources stays reliable month after month. Prowl operates as a single connector, an MCP linking to 444 market intelligence tools, so agents can pull SEO, ad performance, and competitor data into a report template without separately configuring each platform. Typical workflows include auto-assembling the monthly retainer report, generating campaign summaries through an agent, or building out QBR slides straight from the underlying data.
The outcome for account teams is less manual copy-paste and more time actually reviewing what the numbers mean before a report goes out the door. See practical examples of these workflows in Prowl’s use cases for market intelligence.
Standardize First, Automate Second
Agencies that jump straight to automation before locking down a standard template usually end up automating chaos. Start smaller: pick two or three pilot accounts and roll out the monthly retainer template first, since it’s the report you produce most often and where time savings compound fastest.
Once that template holds up, centralize it by service line and resist the urge to let every account manager customize freely. A few client-specific variables are fine; a completely different structure per client defeats the purpose. Track how much reporting time you actually save, and watch whether cleaner reports show up in renewal and upsell conversations. That’s the real return on this work, not the hours saved alone.
— Sergey
Put Your Reporting on Autopilot
Building the templates is half the work. Filling them every month without burning a day of account time is the other half, and that’s where most agencies quietly lose margin. Prowl connects your reporting templates directly to live data across SEO, ad platforms, and competitor tracking, so the KPI snapshot and “what we did” sections populate automatically instead of getting copy-pasted from six different dashboards.

Agencies running this workflow report spending far less time on data assembly and more on the narrative clients actually value, the part that supports renewals and upsells.
| Manual reporting | Template + Prowl automation |
|---|---|
| Hours copying metrics from each platform | Data pulls automatically into the template |
| Inconsistent formatting across accounts | One master template per service line |
| Narrative rushed at the end | More time for analysis and recommendations |
Connect your first workflow through the getting started guide, or see how teams use it for live market data inside Cursor if your workflow already runs through an AI coding environment.
Where to Find Templates and Reporting Guides
A few resources are worth bookmarking if you’re building or refining a template library. AgencyAnalytics’ guide to managing report templates walks through setting up reusable section templates so you’re not rebuilding layout logic for every client. Venngage’s free report templates offer pre-designed layouts with chart placeholders if you want a design-forward starting point rather than a blank slide deck.
For the anatomy of a genuinely useful monthly report, ClientSignal’s practical client report template is a solid reference on keeping the executive summary and next-steps section tight. Agencies building out a full 90-day reporting cadence around QBRs may also find this marketing analytics playbook useful for structuring the cycle around real decision points rather than arbitrary calendar dates. And for dashboard-first delivery, this content marketing dashboard breakdown shows one approach to structuring a monthly-decision view.
Sources
- Agency Client Reporting: How to Prove Your Value Every Month
- Free printable editable marketing report templates
- Create professional reports and academic papers in minutes with customizable templates and AI writing tools in Microsoft Word.
- Project report template | Jira